
SYSTEMIC DIAGNOSTICS // FIDUCIARY ARCHIVE
THE FIDUCIARY REGISTRY
Independent, non-smoothable intelligence logs and systemic diagnostics compiled over more than a decade of tracing transaction metadata. This archive operates as a sovereign database built to strip away narrative seduction, exposing where portfolio assets are weaponised as pawns within private equity's opaque black box. It equips Level 1 allocators with the precise metrics required to enforce baseline accountability and cleanly separate authentic operational execution from debt-engineered luck.
The Humbug Economy: Narrative Seduction, Mega-Cap Hype, and the Death of Baseline Arithmetic
In a market fuelled by leverage and financial engineering, executive bravado routinely masks a stark lack of genuine competence. Using a leaked $2 trillion AI prospectus as a case study, this forensic diagnosis reveals how the "Humbug Economy" replaces baseline arithmetic with narrative seduction. Discover why allocators must use Invariant Telemetry to pull back the green screen and protect Level 0 capital from structural decay.

"Exactly so! I am a humbug." — W.W. Denslow's original 1900 illustration of Dorothy, Toto, and the Wizard behind the folding green screen.
I. The Anesthesia of Executive Bravado
‘Confidence’, ‘bravado’, and narrative polish are far too easily mistaken for true strength or value.
In markets fuelled by leverage, hype, and financial engineering, executive bravado routinely masks a stark lack of genuine competence. When did we stop to question?
On the surface, portfolio companies and pre-IPO entities are paraded as glittering trophy assets – a masterclass in financial engineering, market tailwinds, and artificially expanded Internal Rate of Return (IRR), with the audience ‘trusting’ every single word. Yet, when you step out of the comfortable glow of the ‘Streetlight Effect’ – searching for health only where the light is convenient – and observe raw operational reality, the narrative instantly disintegrates.
Traditional due diligence has become an exercise in passive consensus. Management pitch decks are rubber-stamped by advisory firms charging billable hours to compile consulting salads, while institutional allocators are fed smoothed accounting metrics designed to simulate ‘Alpha’ out of pure market ‘Beta’ and cheap debt. This creates a dangerous Illusion of Health. Underneath the surface-level polish, internal operational decay, customer disconnects, and un-hedged liabilities quietly hollow out the enterprise core.
II. Toto as Invariant Telemetry: Looking Behind the Green Screen
It is the corporate world’s classic Wizard of Oz narrative.
In L. Frank Baum’s original 1900 text, the grand ruler of Oz was not exposed by a rival army, nor by a complex financial audit. He was revealed by Toto the dog, who trotted into the corner of the room and knocked over a small folding green screen. The larger-than-life persona controlling the thunder, smoke, and noise collapsed instantly into an ordinary man operating a mechanical set of levers, forced to confess: ‘Exactly so! I am a humbug.’
• Searches under convenient, pre-approved accounting metrics.
• Accepts management pitch decks and green dashboard views.
• Confounders: Adjusted EBITDA, smoothed IRR, and debt-driven multiples.
• Result: Trapped inside the CEO Bubble.
• Steps past the bright light into un-smoothable baseline data.
• Traces raw transaction metadata directly from Level 5 to Level 0.
• Knocks over the narrative wrapper to inspect core operational physics.
• Result: Exposes the Hollow Core before liquidity events.
Toto represents Invariant Telemetry. He does not listen to executive narratives, he is un-seduceable by corporate hospitality, and he cannot be bought with performance-fee promises. He simply reacts to smell, friction, and ground truth.
In modern private equity and venture capital, institutional allocators rarely lack data; they lack independent rulers. When due diligence is restricted to the financial metrics provided by the sellers themselves, allocators are looking at a rigged mirror. To break this one-way mirror, you do not need bigger financial models or AI prompt generators; you need an un-smoothable, diagnostic lens capable of pulling back the green screen.
III. The Half-Trillion-Dollar Humbug: A Real-Time Diagnosis
Look no further than a recently leaked, confidential IPO prospectus from one of the world’s leading frontier AI laboratories. Pitching a valuation target of over $2 trillion, the headline numbers revealed to the market provide a textbook case study in narrative hype completely eclipsing economic reality:
Target Valuation: >$2,000,000,000,000 ($2 Trillion+)
Annual Revenue (2025): ~$4.6 Billion
Operating Loss (2025): ~$8 Billion
Net Loss (2025): ~$42 Billion (including ~$34B in non-cash financing charges)
Future Infrastructure & Cloud Commitments: ~$518 Billion
2025 Revenue Target
2025 Operating Loss
Net Loss (incl. $34B Non-Cash Charge)
Future Compute Commitments
Diagnostic Takeaway: Generating $4.6 billion in top-line revenue while burning $8 billion in operational cash and locking the enterprise into $518 billion in non-cancellable compute liabilities represents an unprecedented unit-economic imbalance. When a business relies on terminal multiple expansion to offset structural operational deficits, it is no longer an asset; it is a financial wrapper on an un-hedged liability.
Narrative hype over economic reality? Absolutely.
When an enterprise commits over half a trillion dollars in future capital expenditures to generate single-digit billions in top-line revenue—all while losing nearly double its revenue at the operating level—it has crossed from growth investing into the realm of Space Alchemy. The market is asked to underwrite a $2 trillion valuation not on current operational efficiency, but on the narrative promise that scaling compute will magically solve underlying unit-economic friction.
IV. The Epistemological Drift Toward Corporate Idiocracy
When did we stop to think?
It feels like we are walking perilously towards Mike Judge’s Idiocracy (2006)—a world where critical thinking, root-cause inquiry, and baseline arithmetic are systematically replaced by blind cheerleading and institutional consensus.
The most dangerous phase of institutional decay is the quiet 'Illusion of Health'. When $2 trillion valuations attached to $8 billion operating losses are swallowed without inquiry, the market suffers from systemic cognitive closure. We are replacing hard operational telemetry with emotional belief—mistaking executive noise for enterprise velocity.
In Judge’s dystopian satire, society falters not because it lacks technology, but because it abandons the willingness to ask why. It replaces empirical observation with slogan-driven repetition.
We see the exact same pathology inside boardrooms, investment committees, and GP pitch meetings. Executives swallow their own narrative wrappers, operating inside a self-referential CEO Bubble where lower-level operational warnings are filtered out long before they reach the board.
It is an uncomfortable world, especially when the thin veneer of confidence dissolves instantly the moment you look past the hype and see the hollow core underneath.
V. Reclaiming Fiduciary Sovereignty for Level 0 Capital
Where does this structural decay ultimately land? Who bears the cost when the green screen falls over and the humbug is exposed?
Capital begins at the absolute zenith of this system: Level 0—the post-tax human bedrock of civil servants, teachers, and firefighters, alongside generational UHNW estates.
This wealth cascades down through Level 1 Limited Partners and advisory vectors to Level 3 General Partners, where institutional traceability disappears into financial engineering, NAV mark-ups, and fee extraction.
Capital is deployed into day-to-day corporate operations. Beneath surface-level spreadsheet metrics, hidden operational plaque and structural friction accumulate, silently hollowing out the enterprise core[cite: 1, 3, 5].
The ultimate survival of this entire vertical pipeline is determined at the Level 5 End-Customer node. When a fund sponsor relies on narrative wrappers over operational execution, the circuit snaps, hollowing out the asset and leaving the Level 0 originators holding nothing but structural deficits[cite: 3, 38].
The cost of narrative seduction is never borne horizontally by the architects who design the financial wrappers. It is borne vertically.
When General Partners manipulate Net Asset Value (NAV) mark-ups, deploy ‘lazy leverage’, or push toxic Continuation Vehicles (CVs) to hide decaying assets, the liquidity deficit flows all the way down to Level 0.
Level 0 is the post-tax human bedrock of our economy. It is the capital of civil servants, teachers, firefighters, municipal pension funds, and generational Ultra-High-Net-Worth (UHNW) estates. When a $2.5 billion trophy asset turns out to be a zombie asset trapped in a 20% bankruptcy loop, it is Level 0 capital that pays the ‘Integrity Tax’.
Institutional allocators do not need to fill out passive ESG questionnaires or review billable-hour consulting reports. They must demand independent, non-smoothable diagnostic evidence that isolates authentic GP operational skill from debt-engineered market luck.
Let’s pinpoint the exact friction and validate the absolute truthfulness and trustworthiness of the manager holding your capital.
“To see the invisible, we simply need new rulers.” — Morten J. Sørensen
The 30-Year Promise vs. The 5-Year Flip: A diagnostician’s view on EIOPA, Private Equity, and the structural blind spots of EU insurance regulation.
EU insurance regulators face a structural paradox: balancing 30-year policyholder liabilities against aggressive 5-year Private Equity return loops. Discover why legacy supervisory frameworks and the "Streetlight Effect" fail to protect policyholders, and how Invariant Telemetry can expose the true operational health of PE-backed insurers before cases like the Eurovita collapse repeat.

The "Streetlight Effect" in action: Regulators are often constrained to examining static balance sheets (illuminated), while the complex, operational risks of Private Equity ownership hide in the shadows
Recently, Reuters reported that EU insurance regulators are demanding a long-term view from private equity buyers.
When evaluating these Private Equity (PE) acquisitions, regulators face a structural paradox: they must balance 30-year policyholder liabilities against PE return loops built for aggressive 5-to-7-year turnarounds.
This is not a failure of due diligence. It is a fundamental obstacle of legacy supervisory frameworks. Seeking to sharpen oversight beneath the same failing, lobby-bound streetlight is impossible; regulators must step outside that light.
The Streetlight Effect in Regulation
Current protocols evaluate PE buyers based on qualitative assurances—essentially, requesting ‘post-acquisition strategies’. This “we promise to do our best” model lacks a sovereign, invariant, and un-smoothable operational-health monitor backed by enforceable accountability.
Regulators remain trapped by the ‘Streetlight Effect’: examining static balance sheets where accounting rules cast light, while operational risks silently migrate into unmonitored corners.
This regulatory blind spot overlooks three critical structural realities:
Financial Engineering: PE buyers frequently route policyholder capital into illiquid private credit, or transfer risk via complex funded reinsurance into offshore hubs like the Cayman Islands.
Geographic Concentration: While PE holds a seemingly modest 2.4% of overall EU insurance assets, this average conceals extreme, localized concentration.
The Transatlantic Fallacy: Investors vastly overestimate how easily US and UK playbooks can be transplanted to continental Europe. They ignore distinct product structures, consumer behaviors, legal frameworks, and the stark reality of PE’s 20% failure rate.

Figure 1: Why macro averages mislead: While PE holds just 2.4% of total EU insurance assets, localized concentration reaches up to 20% in specific national markets.
The Eurovita Warning
We do not have to guess what happens when these realities are ignored. We witnessed it in 2023 with the Italian insurer Eurovita, backed by PE firm Cinven.
In that instance, self-reported assurances masked deep liquidity decay. The true state of the insurer was obscured until regulatory intervention didn’t just become necessary—it became imperative to prevent widespread fallout. It is a textbook example of what happens when regulators rely on static reporting rather than real-time operational reality.
The Solution: Invariant Telemetry
So, what becomes possible if regulators move beyond static compliance questionnaires?
They must evaluate execution via an Invariant Insurance Telemetry Repository (IITR)—a real-time, tamper-proof record of operational reality. Measuring an insurer through invariant telemetry elevates supervision from governance theatre to empirical clarity.
It proves, mathematically and operationally, whether a General Partner is acting as an ‘Operational Architect’—enhancing genuine efficiency—or merely relying on aggressive cost-cutting and offshore risk-shifting.
Tying approval covenants directly to certified operational health under Solvency II Pillar 2 restores true authority to regulators. If the European Insurance and Occupational Pensions Authority (EIOPA) is to protect European policyholders, it cannot rely on empty promises.
To govern the unmanageable, we simply need new rulers. For supervisory authorities and policy leaders, the invariant models and architectural frameworks required to establish this operational panopticon stand fully engineered. It is time to use them.
The Architecture of Trust: Underwriting Operational Integrity over Narrative Seduction
What do a €20 social media scam and a multi-billion-dollar corporate "Space Alchemy" play have in common? Structurally, absolutely everything. The CRAP Index forensically diagnoses and exposes how engineered narrative wrappers hollow out operational core realities, empowering institutional allocators to protect Level 0 capital (Individual Contributor).

What do a €20 social media consumer scam and a multi-billion-dollar corporate “Space Alchemy” play have in common?
If one looks closely at the underlying data, the answer is clear: on the surface, absolutely nothing; structurally, absolutely everything.
When observing the unregulated proliferation of advertisements for a miracle "Mini AC" room cooling unit—purporting to cool a 37-square-metre room from 37°C to 17°C in a mere three minutes, sometimes even 90 seconds—one’s clinical intuition might suggest that its marketing architecture mirrors a complex corporate restructuring plan or a speculative mega-cap asset turnaround. This intuition is entirely correct. In systems dynamics, network science, and forensic corporate diagnostics, the topographical layout of the deception is identical. There is always room for a plethora of meaningless words designed explicitly to make the impossible sound possible.
Both models operate inside an Opaque Black Box. Both rely upon a highly premium-priced narrative wrapper—engineered from systemic operational friction (the CRAP Index, detailed below)—explicitly designed to exploit intense human desire, status-seeking, or a competitive fear of missing out (FOMO). To a most disastrous degree, both configurations use the narrow, convenient beam of the Streetlight Effect to manipulate surface-level compliance metrics while completely hollowing out the absolute reality and truth of the underlying operational core.
Whether the asset is a cheap plastic box containing wet cardboard and a five-volt computer fan worth a few euros, or a hyper-capital-intensive infrastructure empire loaded with billions in debt to fund an artificial orbital AI monopoly, the mechanics of the illusion remain identical. Once a forensic scan is applied to the raw asset, the physics of the system reveals the same immutable truth: when a value proposition separates its authored perception from the absolute reality of its execution, structural failure is the only remaining mathematical boundary condition.
Decisively, a critical mass of capital allocators and consumers invariably swallows these engineered lies, providing the systemic momentum required to justify their continuation. The tragedy inherent in this architecture is that by the time reality collapses the facade, immense pools of investor value have already been extracted by the architects of the illusion. The venture or asset is quietly liquidated or buried under sequential refinancing rounds, leaving both everyday retail consumers and institutional pension funds holding nothing but structural deficits. The sponsor then seamlessly transitions to the next target asset, rebooting the playbook with absolute impunity. This loop persists because desire drives us all to stare and look under that same streetlight, hoping we have found that unique something which no one else has seen, and then pretending we possess genuine operational skill rather than owning the fact that we simply have better words to cover our market luck.
The Architectural Breakdown: Mapping the Twin Illusions
The reason the financial establishment has never been able to resolve these systemic inquiries, nor ever will, is that they operate under the restrictive cognitive bias of the Streetlight Effect—searching for structural value only where it is easiest to measure. Legacy operators function as “lightbulb consultants”, attempting to replace an isolated component under an antiquated streetlamp in the unexamined hope of illuminating a new operational reality. They innocently believe that to render governance observable, they must compel fiduciaries to complete longer compliance questionnaires, submit retrospective disclosures, or execute look-back administrative audits.
They seek validation within self-reported, backward-engineered General Partner documents—attempting to gauge true luminescence by analysing the paint layers of Giacomo Balla’s oil painting Street Light (1909), rather than measuring the actual photons colliding with, and scattering off, the real-world obstacles hidden within dark alternative asset classes. Human eyes are biologically limited to the visible spectrum, and standard due diligence is no different. It only sees the yellow stars of engineered valuation spikes, mega-cap hype, and blockbuster debt syndications. The operational screams—the red stars of compounding structural decay—are perfectly clear once you deploy the algorithm required to scan the invisible spectrum of “Shadow Data” and display the artefacts.
Advancing the topology of directed delegation from a conceptual blueprint into an adopted sovereign regulatory standard requires the absolute rejection of these linear, administrative metrics. To make governance empirically observable, the architecture must bypass subjective corporate narratives entirely—one that is fundamentally independent of subjective experiences and fluid opinions. It requires an active empirical invariant measurement layer capable of tracking the unique, raw kinetic collision signatures embedded within the asset's transaction metadata at the absolute root-cause level.
To achieve this, the system maps the full end-to-end transaction flow across every primary node, starting from Level 0: The Individual Contributor—the firefighters, teachers, and civil servants whose capital forms the bedrock of sovereign wealth vehicles, passive index funds, and pension allocators. Through the optimisation of allocation algorithms, the active intent of the Level 0 contributor is too often decoupled from reality, funnelled automatically into premium narrative wrappers carrying massive structural dilution.

FIGURE 2: The Closed-Loop Tracking Layout. Mapping the structural descent from Level 0 Post-Tax Capital through intermediate fiduciary vectors down to the terminal Level 5 Customer Node
Without checking this circuit, capital energy is harvested programmatically at the boundary, completely shielding issuers behind concentric, insulated governance firewalls.
To counter this boundary condition, the asset must be evaluated precisely as a cardiologist examines a patient:
The clinical presentation “appears” flawless (the curated trophy narrative).
The establishment dictates standard observation (conventional reporting metrics).
The scan exposes absolute, internal plaque buildup (as an uninfluenced, invariant percentage).
The protocol is derived from the exact physical and computational science underlying a medical Coronary Artery Calcium (CAC) scan. LPs could hold such a key today—fundamentally changing the internal power dynamics across Level 1 through Level 3 entirely. By running an empirical CAC scan equivalent—utilising external shadow data to trace operational telemetry—LPs can tangibly calculate invariant health without ever demanding transparency or requiring GP permission. By looking past the exterior of the black box, a thirteen-year ambiguity collapses, and true operational skill is finally separated from market luck.
1. Narrative Alchemy: “NASA Space Scientists” versus “Tech-Style Multiples”
The Consumer Scam: The advertisement constructs a high-octane origin story. A fictional inventor named “Steve” reverse-engineers a device using “liquid compressed cooling cartridges” and “NASA space scientists” parameters to disrupt a multi-billion-pound industry. This science-fiction narrative acts as an emotional permission slip to bypass basic thermodynamics and critical thinking.
The Financial Engineering: The macro-scale corporate manifestations employ an identical playbook. Insiders and advisors take core industrial, connectivity, or aerospace infrastructure and carve out highly speculative segments. They brand this internal engineering shift as an exponential “AI and orbital data paradigm”, chasing speculative, hyper-growth tech multiples (often exceeding 50x to 65x EV/EBITDA) from an uncritical market. The narrative wrapper glitters beautifully under the Wall Street streetlight, masking the reality that incoming public investors are paying a premium entry price of $135.00 per share for an underlying asset baseline carrying an un-bookable pro forma NAV of a meagre $3.32. The $126.13 per share gap is legally categorised as paper dilution—swapping capital for pure, on-paper nothingness while physical assets are completely starved of cohesive operational capital. This science-fiction narrative acts as an emotional permission slip to bypass basic thermodynamics and critical thinking.

FIGURE 3: The SpaceX Dilution Ledger and the GAAP Observability Gap. Detailing the extreme mathematical disconnect between the market purchase price and tangible assets recorded on the balance sheet.
2. The Boundary Surcharge: Hidden Handling Fees versus NAV Squeezing
The Consumer Scam: The consumer is seduced by an unverified headline price (e.g., RRP €140 reduced to only €70 with a promised 50% discount alongside a waterfall of claimed performance benefits). However, the checkout interface deliberately hides shipping, processing, and transaction markups until the final checkout trigger is pulled, executing a non-disclosed surcharge that raises the real cost by ±21% to over €85. At that point, reading the returns policy is entirely futile.
The Financial Engineering: General Partners (GPs) and financial architects execute the exact same capital harvest. Through the mechanisms of NAV Squeezing, dividend recapitalisations, and sudden structural capital raises, sponsors layer high-yield debt onto the capital structure to pay themselves unearned performance rewards, syndicate risks, and fund speculative infrastructure.
In a staggering manifestation of this pathology, SpaceX raised a historic $86 billion in an equity IPO at a $1.78 trillion valuation, only to turn right around less than two weeks later to execute a blockbuster $25 billion debt sale to service its unmodelled burn. This rapid, sequential capital harvesting creates a programmatic conduit that siphons value straight from Level 0 individual contributors—the everyday firefighters, teachers, and civil servants whose automated passive indexing engines are forced by revised benchmark weighting algorithms to absorb the low-float asset debut.
3. Core Cannibalisation: Cardboard Soup versus the AI Cash Burn
The Consumer Scam: Once the Opaque Black Box of the mini cooler is opened, the reality is exposed as an anaemic computer fan blowing air across strips of damp cardboard. It does not cool the room; it merely humidifies the air, creating a breeding ground for mould, mildew, and respiratory pathogens. The product actively destroys its own functional environment.
The Financial Engineering Reality:To satisfy the spreadsheet and appease public retail mania, corporate architects leverage highly profitable, terrestrial connectivity monopolies (such as Starlink) to fund speculative, hyper-capital-intensive segments. Beneath the narrative wrapper, the newly retrofitted segments act as a massive cash incinerator. In fiscal year 2025, uncapitalised AI infrastructure CapEx scaled exponentially to $12,727 million, dragging company-wide operations down to a consolidated net loss of $4.9 billion on revenues of $18.7 billion. To satisfy interest obligations, the executive team must execute aggressive "Value Engineering" and cost-shifting, leaving the foundational segments vulnerable to structural decay.
The Financial Transmission Mechanism: The CRAP Index
When an asset substitutes narrative alchemy for an operational execution playbook, the customer’s and bondholder’s resulting disillusionment is not an abstract, qualitative sentiment; it transmits directly to the balance sheet as a binding liability. This systemic erosion can be quantified through the CRAP Index, measuring the absolute Integrity Tax paid when process, data, and reality disconnect:

FIGURE 4: Root-Cause Contagion Graph. Quantifying the precise financial transmission vectors where underlying operational friction maps directly to enterprise and credit value decay.
C – Customer & Bondholder Churn Surcharge: In the consumer scam, the buyer realises the unit is junk and vows never to purchase from the platform again. In mega-cap asset management, when actual cash flows fail to match narrative expectations, a severe friction occurs between equity and credit markets. Fixed-income investors—who lend based on actual cash flows rather than expectations—quietly flee the brand, triggering an immediate sell-off. SpaceX’s long-term debt maturing out to 2056 saw credit spreads widen dramatically to 2.01 percentage points within days of issuance, pushing yields to nearly 6 per cent—trading metrics closer to speculative, junk-rated borrowers than investment-grade assets.
R – Return and Process Inefficiencies: The accumulation of infrastructure friction, uncapitalised operational losses, delayed delivery latencies, and supply chain blockages. This represents the primary ledger lines of the Ghost Economy Deficit (GED)—the invisible drag that flatlines sustainable growth.
A – Attrition and Warranty Claims: The compounding operational overhead required to manage systemic product defects, resolution fatigue, credit card chargebacks, and regulatory compliance interventions.
P – Pace of Operational Scale: The exponential multiplier determined by the velocity and volume of the asset’s deployment across an unreachable Total Addressable Market (TAM).
When an asset carries a catastrophic Asset Inefficiency Score (AIS), the CRAP Index compounds exponentially. The sponsor is forced to burn immense amounts of equity and marketing capital simply to maintain a broken equilibrium, frantically chasing new users, retail meme-stock followers, or reactive mergers to replace the core audience that is actively escaping the asset core.
The Epistemological Fallacy: Defying Thermodynamics and Economics
The fatal error shared by the creator of the internet scam and the architects of aggressive financial engineering is an identical epistemological blind spot: they believe they can break the laws of physics and economics with impunity.
The internet marketer knows their plastic device cannot drop a room by 17°C in three minutes or less via a basic USB cable, but there are no safeguards to stop them. As any HVAC design engineer will demonstrate, executing that thermal shift requires an absolute cooling capacity exceeding 10 kW—an energy draw that would instantly incinerate a standard USB plug.
In exact parallel, the private equity or mega-cap financial engineer believes they can layer debt loads past critical boundaries, project a $28.5 trillion addressable market that assumes a single company can capture 30 per cent of planet Earth’s entire economic output, and somehow still maintain an anti-fragile corporate legacy. As Allianz CIO Ludovic Subran dryly observed on the friction between narrative and debt servicing:
“Equity investors, you can take them to Mars. Bond investors are, like, ‘where is my coupon?’”
This is the corporate manifestation of Frédéric Bastiat’s and Henry Hazlitt’s classical warning: they focus exclusively on the immediate, localised cash extraction (what is seen under the corporate streetlight) while remaining structurally blind to the long-term, adverse ripple effects that destroy the asset’s structural integrity across all groups (what is unseen in the shadows).
Robust top-line metrics and paper Net Asset Values (NAVs) mean absolutely nothing if the backstage operational execution is failing. You cannot financially engineer your way out of the causal inefficiencies of a broken customer and credit reality. Eventually, mathematics always solves for X, and gravity wins—even in space.
The Governance Moat: Architecture of the Insulation Firewall
Because the true value of these structures is entirely un-booked and detached from traditional public market cash flows, management pre-emptively engineers airtight corporate defence mechanisms. This ensure that public market impatience, credit volatility, or hostile activist shareholders can never legally force them to defend a balance sheet that fails to reflect reality. The governance framework operates with absolute, clinical insulation through three distinct layers of corporate masonry:
Absolute Voting Concentration: Public retail investors are issued common stock carrying 1 vote per share, while insiders hold Class B shares carrying 10 votes per share, concentrating unilateral control over board compositions and strategic capital allocation.
The Activism Firewall: Under section 21.552(a)(3) of the Texas Business Organizations Code (TBOC), bylaws specify that any shareholder or group seeking to maintain a derivative legal suit or proposal must continuously hold at least 3 per cent of the outstanding voting shares for six months. At a premium entry price of $135.00, entering that governance gate requires an insurmountable capital position of approximately $53 billion, rendering traditional activist pressure legally impossible.
Class Action Immunisation: Forum selection bylaws explicitly prohibit shareholders from bringing internal corporate disputes as a collective mass action, forcing individual adjudication to completely neutralise minority shareholder leverage.

FIGURE 5: The Architecture of Insulation. Concentric structural rings engineered to harvest public liquidity while completely immunising management from public market accountability.
Unlocking the Clinical Eye
The antidote to this systemic manipulation is a state of total operational detachment. When a diagnostic strategist or investor is entirely unconcerned with personal accumulation, corporate benefits, or the seductive traps of immediate financial padding, their vision is cleared. They sit silently in the panopticon, observing unobstructed. They are no longer operating within the emotional field of the seller's narrative. That is Sovereign Trust.
By operating entirely outside the emotional gravity of the prize, the diagnostician can forensically strip away the narrative wrapper, pierce the Opaque Black Box of standard operations, and expose the structural lies sitting silently underneath.
“For those of us who want to see the truth, interrogating Invariant Telemetry breaks the GPs’ hold on the one-way mirror of sovereignty, moving LPs from passive “Price Takers” to Sovereign Arbitrators of Value.”
Lacking the desire to possess the asset means one possesses the freedom to independently deconstruct it. Where colleagues and competitors are blinded by the bright allure of polished pitch decks, the detached observer employs a calm, clinical eye.
By utilising independent, uninfluenced telemetry—an invariant, uncorruptible Organisational CT Scan—investors, strategists, and LPs can bypass the smoke and mirrors of standard due diligence, trace the raw operational breadcrumbs back to their absolute root causes. These are seen, and thus measurable, through the Small-World Network lens tracing the friction points from Level 5 right through the organisational pyramid up to Level 0, the ultimate funding source. The panopticon has been built; it is time for the LPs to step into the watchtower. This framework alone insulates sovereign capital from the catastrophic 20% bankruptcy loop.
Turn on the lights, discard the commoditised playbooks, and look at the world precisely as it executes, rather than how it chooses to portray itself.
To see the invisible, we simply need new rulers.
The Space Alchemy: Exposing the Observability Paradox and the Streetlight Effect in the $1.77T SpaceX IPO
The $1.77 trillion SpaceX IPO isn't just a market milestone; it is a masterpiece of financial alchemy. By applying an Organisational CT Scan to the prospectus, this forensic diagnosis exposes a 93 per cent immediate paper dilution, a massive AI cash incinerator, and the engineered Nasdaq index rules designed to passively harvest your capital while immunising management behind a $53 billion governance firewall.

The global capital markets are currently transfixed by the dazzling trajectory of the upcoming Space Exploration Technologies Corp. public offering. Under the trading symbol $SPCX, the company seeks to execute the largest initial public offering in corporate history, aiming to raise $75 billion gross by offering 555,555,555 Class A common stock base shares at a targeted price of $135.00 per share. The resulting market capitalisation positions the entity at a staggering implied valuation of approximately $1.77 trillion.
Beneath the current wave of retail mania—underpinned by absolute devotion to the founder and amplified by an unusually high 30 per cent retail allocation carved from a public float constituting a mere 4 per cent of total outstanding shares—lies an architectural optical illusion. Traditional equity research stands divided; whilst speculative retail momentum demands a premium based on blind faith, traditional institutional valuation models discount the target pricing by up to 48 per cent, citing unproven monetisation pathways, and structural opacity.
To approach an offering of this magnitude like a true forensic diagnostician—a Strategic Bloodhound—one must deliberately look away from the flashing lights of the rocket pads and conduct an Organisational CT Scan on the raw ledger. When one strips away the narrative hype, the prospectus exposes an extraordinary structural asymmetry designed to harvest deep public capital whilst completely immunising management from public market accountability.
1. The GAAP Optical Illusion: Purchasing the Un-Bookable Asset Engine
The primary friction point for any rational capital allocator reviewing the prospectus is the severe, mathematical disconnect between the market purchase price and the tangible assets recorded on the balance sheet. The accounting mechanics map out an immediate redistribution of wealth across the share pool that defies traditional public equity expectations:
The Premium Entry Price: Public investors are required to pay $135.00 per share.
The Underlying Asset Baseline: Prior to the public cash injection, the company's historical net assets yield an underlying pro forma net asset value (NAV) of a meagre $3.32 per share.
The Post-IPO Equilibrium: After pooling the massive $74.4 billion in net public cash straight into the general corporate treasury, the as-adjusted pro forma NAV crawls up to exactly $8.87 per share.
The prospectus does not conceal this stark asymmetry; it explicitly categorises the remaining $126.13 per share gap as immediate “dilution in pro forma net asset value per share to new investors”. Every new incoming investor is effectively swapping $126.13 per share for pure, on-paper nothingness.
The Dilution Ledger
Investor Subscription Price: $135.00
Post-Offering Pro Forma NAV: $8.87
Immediate Paper Dilution: $126.13

Figure 1: The SpaceX Dilution Ledger and the GAAP Observability Gap
However, a deeper diagnostic scan reveals that this extreme dilution is not a simple accounting penalty, but rather a vivid demonstration of the Observability Paradox in deep-tech asset classes. Under modern financial reporting standards (U.S. GAAP), standard corporate accounting rules impose a structural “Streetlight Effect”. Because companies are legally restricted from capitalising long-term developmental milestones on the balance sheet, SpaceX is mandated to immediately expense its ultra-heavy innovation costs through the statement of operations.
When the firm expenses $3+ billion developing its Starship launch system or $5+ billion building out advanced xAI compute models and infrastructure in a single fiscal year, those billions are instantly wiped from the asset ledger. Consequently, decades of revolutionary engineering intellectual property, flight data, and frontier model weights are recorded on the official balance sheet at exactly $0.00.
When an investor pays $135.00 per share, they are not buying a fractional stake in existing physical steel, concrete, or solar arrays. They are paying an extraordinary premium to bypass the regulatory blindness of standard corporate accounting and purchase an un-bookable operational capacity.
2. Deconstructing the Science Fiction Narrative: The AI Cash Burn
To evaluate whether this un-bookable engine can ever manufacture monetisable tokens fast enough to justify a valuation premium reliant on exponential, flawless execution, one must isolate the underlying corporate segment metrics. The ledger exposes a highly profitable terrestrial connectivity monopoly that is being structurally leveraged to fund a speculative, hyper-capital-intensive leap into an orbital data economy.
The reportable segments present two entirely separate financial dimensions:
Consolidated Segment Performance (FY 2025)
Whilst the Starlink consumer and enterprise engine operates beautifully—generating strong segment income from operations—the newly integrated AI segment is a massive cash incinerator. The AI segment dragged company-wide operations down to a consolidated net loss of $4,937 million in 2025, driven by a rapid, uncapitalised CapEx scale-up from $463 million in 2023 to $12,727 million in 2025.
As Wall Street legend Steve Eisman succinctly summarised the situation on CNBC:
“What I love about the S-1 is that it reads like a science fiction novel. It really does.”
For the experienced asset allocator, this structural configuration reveals a familiar operational playbook. The architect of this offering possesses a documented track record of utilising long-duration, narrative-driven technological horizons—most notably demonstrated via historical capitalisation cycles within the electric vehicle sector—to command immense capital premiums from an inelastic retail investor base long before the underlying technology achieves commercial maturity. Furthermore, the alleged subsequent retrofitting of digital agreements to manage downside liability underscores a broader corporate strategy: leveraging absolute public market devotion to fund highly speculative infrastructure, whilst structurally shielding the issuer from legal volatility, operational compliance metrics, and financial downside when execution timelines inevitably expand.
The primary structural pathogen hidden in the prospectus narrative lies in the company's definition of its Total Addressable Market (TAM). SpaceX claims a quantifiable TAM of $28.5 trillion, of which an astonishing 85 per cent ($26.5 trillion) is tied entirely to artificial intelligence applications and enterprise infrastructure.
To put this macro projection into perspective: a $28.5 trillion addressable market implies that a single corporate entity intends to capture nearly 30 per cent of the entire economic output of planet Earth—and plans to do it by selling highly commoditised, non-differentiable Large Language Models (LLMs) rather than core orbital launch systems.
To achieve those metrics, the firm would effectively need to automate the cognitive output of the entire global working population—all 3.5 billion of us.
Conveniently, the prospectus reveals that the founder's multi-trillion-dollar equity bonus tranches trigger only if he establishes a permanent Mars colony of at least one million inhabitants. Removing a million workers from the terrestrial tax base may satisfy interplanetary ambitions, but it represents an unprecedented operational risk for public market investors who require near-term cash generation over long-term cosmic execution velocity.
3. The Synthetic Index Engine: Nasdaq’s Mandatory Institutional Conduit
To ensure the success of this capital harvest despite severe institutional scepticism, the structural layout extends far beyond the corporate bylaws of the firm. It has required an extraordinary regulatory realignment of the public market infrastructure itself. To facilitate the immediate inclusion of SpaceX into major benchmarks like the Nasdaq-100, Nasdaq has adjusted its historical “seasonin” and weighting rules specifically to accommodate megacap private companies launching initial public offerings.
This synthetic demand engine operates via four radical modifications to standard index methodology:
The “Fast Entry” Protocol: Nasdaq has compressed the mandatory seasoning period—the traditional window a security must trade on the open exchange before index admission—from the historic three months down to just 15 trading days.
The Eradication of Minimum Free Float: Historically, an enterprise required a minimum 10 per cent public float to qualify for index inclusion. Nasdaq has scrapped this requirement entirely to accommodate SpaceX, which is listing with a tightly restricted public float of just 4 per cent of total shares.
The Low-Float Weighting Multiplier: To prevent a highly constrained float from resulting in an artificially muted index presence, Nasdaq has introduced a protocol applying a corporate threefold (3x) multiplier to the weighting calculation of any listing with a float below 20 per cent.
Aggregated Market Capitalisation Metrics: The index updated its methodology to aggregate unlisted and listed share classes collectively, properly capturing the true scale of the entity's megacap valuation for eligibility tracking.
The net effect of these structural interventions is an intentional systemic siphon. It legally compels passive index trackers, automated exchange-traded funds (ETFs), and institutional portfolios to purchase millions of shares of the company shortly after its trading debut. It creates guaranteed programmatic buying pressure on a low-float asset, whilst allowing insiders to preserve absolute control over corporate direction.
From an end-to-end systems perspective, this programmatic conduit exposes a profound boundary condition within the global capital architecture. To map the transaction flow with absolute topological completeness, a forensic diagnostic cannot merely analyse intermediate institutional intermediary nodes; it must trace the circuit to its primary source of capital energy—Level 0: The Individual Contributor.
Whether that contributor is an ultra-high-net-worth patriarch insulating a multi-generational family office estate, or a self-employed freelancer diligently allocating monthly surpluses to secure a retirement pension thirty years hence, these human lives constitute the absolute foundation underlaying sovereign wealth vehicles, mutual funds, and pension allocators.

Figure 2: End-to-End System Topology - Programmatic Capital Harvesting from Level 0 to the Asset Core
Without the individual contributor, the intermediate institutional layers possess zero sovereign capital to deploy.
Through Nasdaq's strategic optimisation of indexation algorithms, the active intent of the Level 0 contributor is entirely decoupled from allocation reality. The individual savings of a freelancer choosing a broad-market passive vehicle are automatically, invisibly, and systematically funnelled into $SPCX to absorb an asset carrying an immediate 93 per cent paper dilution down to book value. Capital energy is harvested programmatically at the system's boundary, leaving the primary wealth creator with zero control over whether or not their savings are weaponised to underwrite interplanetary software alchemy.
4. The Governance Moat: Architecture of the $53 Billion Firewall
Because the true value of the firm is entirely un-booked and detached from traditional public market parameters, management has pre-emptively engineered an airtight corporate defence mechanism. This structure ensures that traditional public market volatility, quarterly earnings anxiety, or hostile activist shareholders can never legally force them to defend a balance sheet that fails to reflect reality.
The governance framework operates with absolute, clinical insulation through three distinct layers of corporate masonry:
Absolute Voting Concentration: Public retail investors are issued Class A common stock carrying 1 vote per share. However, key long-term insiders hold Class B shares carrying 10 votes per share. This dual-class configuration completely concentrates voting dominance, giving Elon Musk unilateral control over board compositions, corporate opportunities, and strategic capital allocation.
The Activism Firewall (The 3% Rule): Under section 21.552(a)(3) of the Texas Business Organizations Code (TBOC), the bylaws specify that any shareholder or group seeking to submit a proposal or maintain a derivative legal suit must continuously hold at least 3 per cent of the outstanding voting shares of the corporation for six months. At the initial public offering price of $135.00, entering that governance gate requires an insurmountable capital position of approximately $53 billion. Traditional activist pressure is rendered legally impossible.
Class Action Immunisation: The forum selection bylaws explicitly prohibit shareholders from bringing internal corporate disputes as a collective mass action or class action. Every dispute must be adjudicated or arbitrated individually, completely neutralising the legal leverage of minority shareholders.
Zero Income Yield: The asset baseline features an explicit confirmation that the company does not anticipate paying any cash dividends in the foreseeable future, stripping away any income padding to protect investors during prolonged infrastructure development timelines.
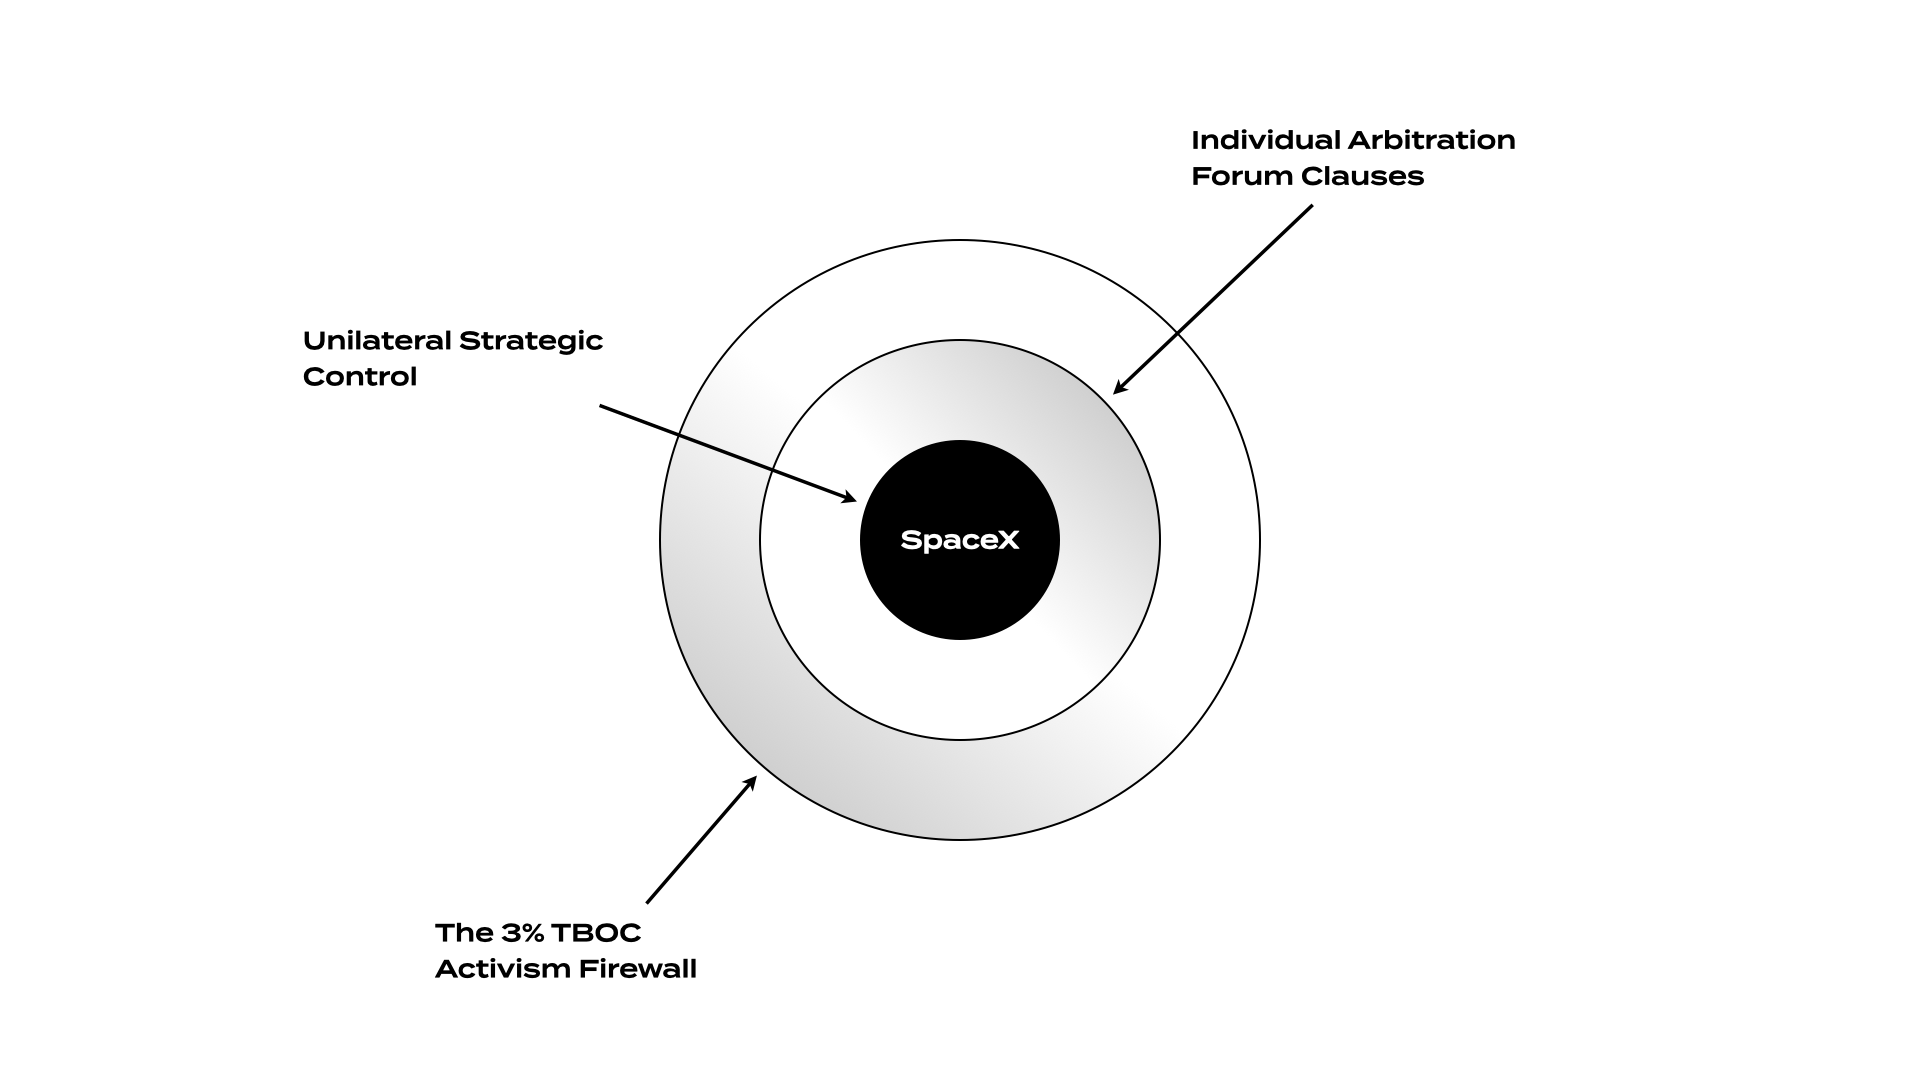
Figure 3: Concentric Corporate Architecture - The Three-Layer Insulated Governance Firewall
The Forensic Diagnostic Verdict
The SpaceX offering represents a historic paradigm shift in the structural layout of the public equity markets. It is not a traditional public listing; it is a giant, late-stage venture capital bridge utilising a public equity framework to harvest sovereign-scale liquidity.
Through custom index adjustments, systemic capital siphoning from Level 0 bounds, and strict governance parameters, management has successfully engineered a capital fortress that completely insulates them from public market impatience.
Investors are not buying a standard, asset-backed stock. They are purchasing a highly premium-priced narrative wrapper around an un-bookable operational ecosystem. The ultimate risk is not the immediate paper dilution down to $8.87; it is whether an investor is willing to trust the narrative completely blindly, knowing that eventually mathematics always solves for X, and gravity always wins—even in space.
Like Eisman, I am not a fan.
When an IPO valuation relies on a market built primarily on speculative AI projections and asteroid mining—rather than core rocket engineering—you are not buying a stock. You are buying a very expensive narrative wrapper.
Sometimes, the best clinical diagnostic is simply knowing when to pass.
(Diagnostic Safety Notice: This essay constitutes a purely clinical, forensic analysis of publicly available regulatory disclosures and prospectus documentation for the purpose of architectural evaluation. It is absolutely not financial advice, a market recommendation, or a live investment tip. I provide this explicit clarification to satisfy overzealous compliance gatekeepers, corporate risk algorithms, and any reader who mistakes baseline asset analysis for a securities endorsement. If you choose to swap your capital for space alchemy, that remains a strictly private matter between your broker, your conscience, and your bank account.)
The Anatomy of a Zombie Asset: Seeing the LPs’ €500 Billion Fiduciary Void
How do we close Private Equity’s €500 billion fiduciary void? This clinical briefing interrogates the "Golden Goose" Ghost Economy Deficit to demonstrate why Limited Partners must transition from passive dependency to Sovereign Agency through independent diagnostic telemetry.
Throughout my life, people have observed: “We don’t understand you. You just seem to sit there thinking.” In a world that confuses “action” with “solving problems”, deep thought is often mistaken for inaction.
But for a diagnostician, thinking is the action.
Last week, a post by Professor Claudia Zeisberger exposed a €500 billion void that three decades of Private Equity industry guidelines have failed to close. Sitting with this data, I wrote “The Golden Goose and the Food Diary” to structure my thinking—synthesising the work of the industry’s most rigorous independent thinkers: Ludovic Phalippou, Claudia Zeisberger, Alexandra Heal, and Baraa Shaheen. It is my clinical look at why Private Equity governance is failing. When it clearly shouldn’t.

While the €500 billion fiduciary void defines the industry-wide emergency, the €513.8 million Ghost Economy Deficit in the Golden Goose case study provides the clinical invariant proof of how that void manifests in a single sponsor-to-sponsor Secondary Buyout (SBO) transaction.
The answer isn’t about LPs “begging” for more granular reporting within the existing ILPA Transparency Pillar—it is the transition from Institutional Dependency to Sovereign Agency. While ILPA provides the necessary legal lamppost, it remains a request-response model that leaves the GP as the sole author of the narrative.
It is about the moral refusal to bet the futures of the invisible, the unheard voices—the teachers, firefighters, nurses, and the workers whose retirements we guard—on an engineered illusion while the host’s structural foundation is being drained.
For those of us who want to see the truth, interrogating Invariant Telemetry breaks the GPs’ hold on the one-way mirror of sovereignty, moving LPs from passive “Price Takers” to Sovereign Arbitrators of Value.
My sincere thanks to the experts mentioned above; your forensic work provided the clinical breadcrumbs that allowed an outside diagnostician’s thinking to validate the structural key to finally close the “invisible” void.
The question I invite the reader to consider is whether the logic holds: LPs cannot truly satisfy their fiduciary mandate while the primary instrument of measurement remains authored and controlled by the party being measured.
The logic of the Briefing Paper is provided below for your audit. To see what is currently invisible, we simply need an autonomous internal ruler.
Beyond the Streetlight Effect: An Alternative Path to LP Autonomy in Continuation Vehicles
With 80% of LPs cashing out of Continuation Vehicles (CVs), the industry is demanding more GP transparency. However, asking for better spreadsheets is merely the “Streetlight Effect”. Discover how LPs can achieve true investment autonomy by bypassing GP narratives and deploying independent operational telemetry—an Organisational CT Scan—to measure invariant asset health.
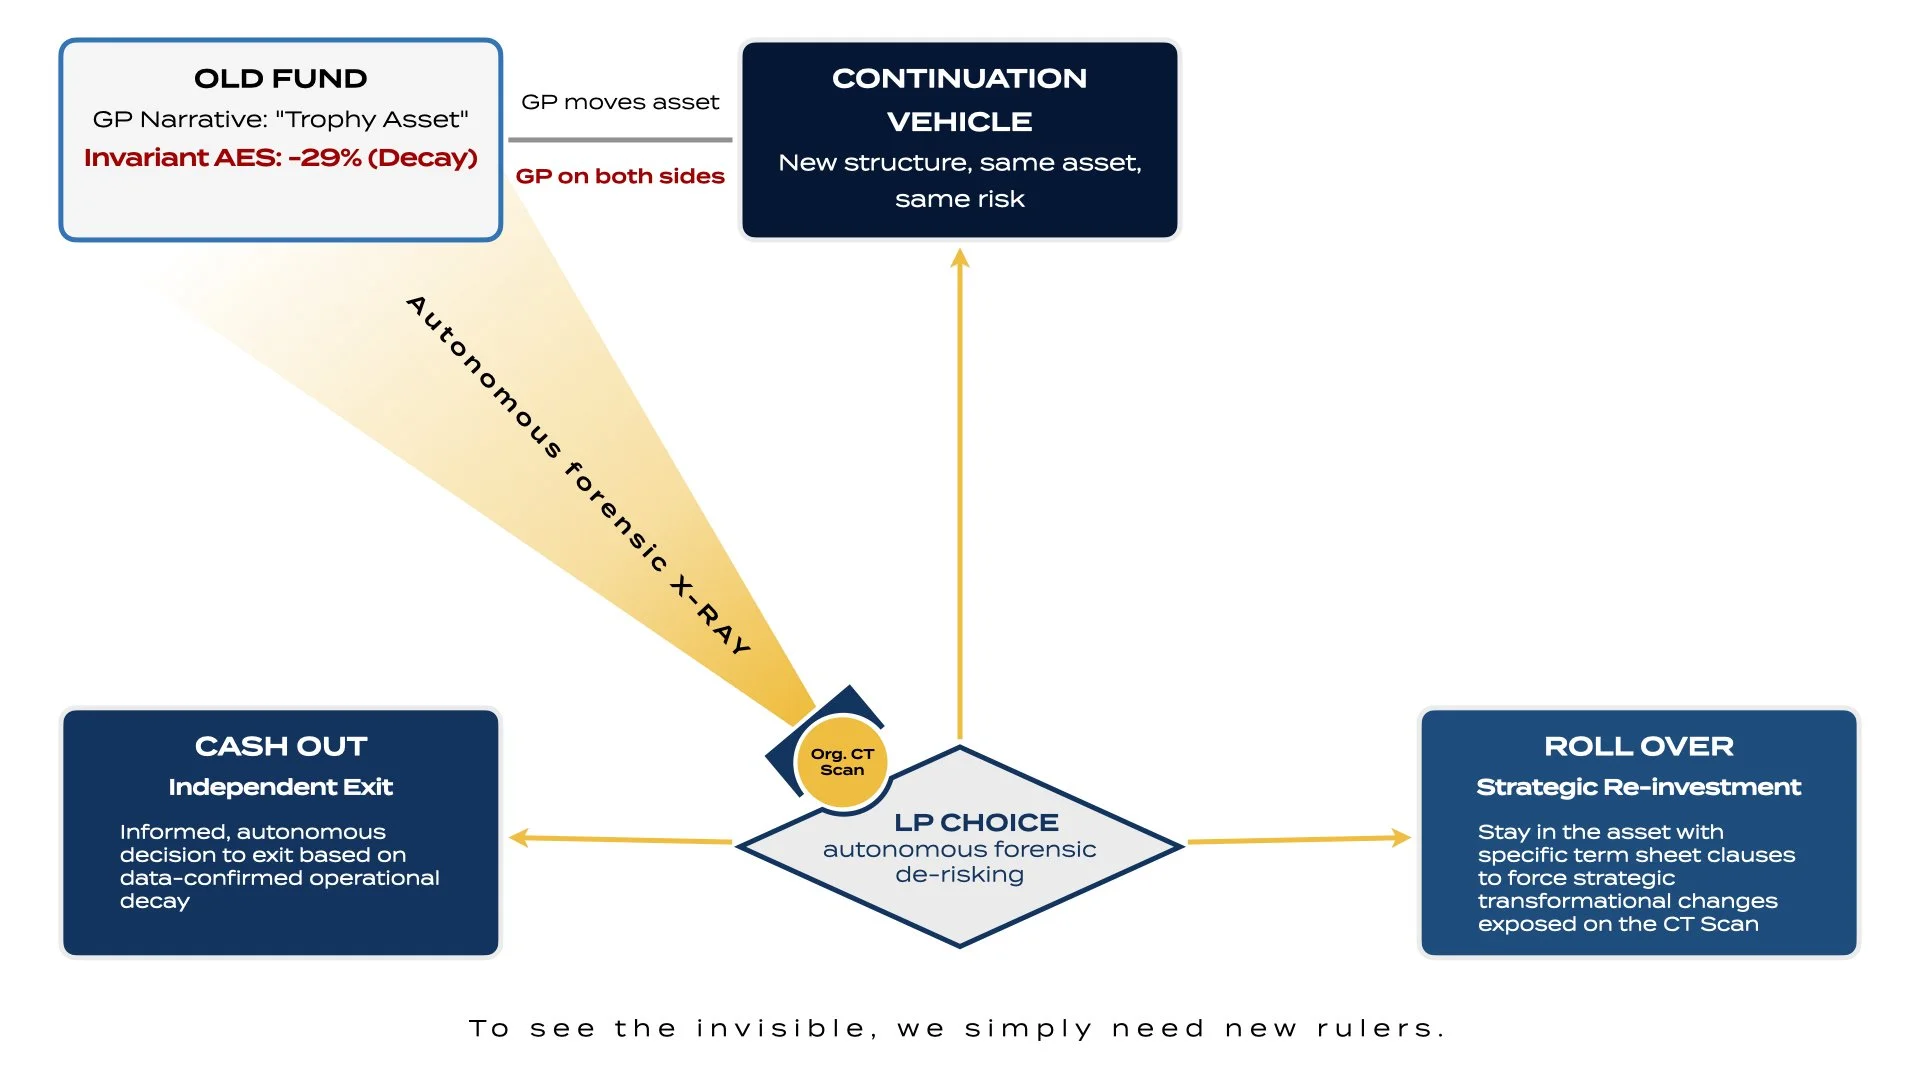
Professor Claudia Zeisberger raises the Private Equity cycle's defining question: when a GP moves a trophy asset into a Continuation Vehicle (CV), “Do LPs actually understand what they're being offered to roll into?”
As a lead diagnostician, my answer is no—but the “why” offers a fascinating opportunity.
This uncertainty drives severe market friction. Alexandra Heal’s Financial Times report “Private equity investor body sounds alarm on ‘conflict vehicles’” highlights a structural symptom: 80% of LPs cash out of CVs, increasingly viewing them as “conflict vehicles”. Consequently, ILPA is rallying General Partners (GPs) for more “transparency”.
I view this challenge differently. Demanding transparency within the current system mirrors the “Streetlight Effect”—searching for the lost keys under a lamppost simply because that is where the light is.
Here, financial models and GP-authored memos are the lamppost. Limited Partners (LPs) ask GPs to turn up the brightness (transparency). Yet, if an asset’s root-cause contagions lie outside that illuminated circle, brighter engineered metrics will not locate the missing keys.
To see the invisible opportunity, we must assess asset health exactly as a cardiologist examines a patient:
The patient “looks” fine (the GP’s “Trophy Asset” narrative).
The doctor prescribes standard treatment (conventional CV pricing and memos).
The scan exposes undeniable arterial plaque as a percentage, confidently providing a risk assessment (hidden structural decay).
A CAC scan bypasses surface symptoms to measure physical reality. If an asset hides a 29% structural decay beneath its financial façade, asking GPs for better spreadsheets will not uncover it.
A suggestion perhaps is move beyond prescribed guidelines hoping for GP collaboration, and instead explore autonomous PE “CAC Scores”.
LPs could hold such a key today. By running an CAC scan equivalent—using external shadow data to trace operational telemetry—LPs tangibly could calculate invariant health without demanding transparency or GP permission.
Shifting to such autonomy, would open an alternative path for LPs in Continuation Vehicles, without conflict. Independent telemetry evolves LPs into autonomous decision-makers.
To see the impossible, we simply bring a new ruler.
In the Outer Space of Limited Partnership: MAPPING THE OPERATIONAL SKILL OF PRIVATE EQUITY’S GPS
In the ‘Outer Space’ of Private Equity, Limited Partners are left holding decaying assets while GPs manufacture unearned performance fees. By applying an Organisational CT Scan to 13 years of Golden Goose's telemetry, this diagnostic exposes the ‘NAV Squeezing’ illusion—proving it is entirely possible to separate true GP skill from financial engineering.

‘In the Outer Space of Limited Partnership, nobody can hear when anybody screams.’Recent industry discourse—spearheaded by financial risk experts like Victor Hong and Larry Mohs—has laid bare the mechanics of ‘NAV Squeezing’. This is the practice where General Partners (GPs) manufacture unearned performance fees through rapid accounting mark-ups, leaving the Limited Partners (LPs) footing the bill.
The financial diagnosis is bleak. But if you recalibrate the frequency to filter out the financial background noise, the void is not silent at all. Outer space is not empty; it is simply unmapped.When you bypass the financial façade and zero-beat the true operational waveform, the exact illusions described by Wall Street watchdogs play out in real time.
The 13-Year Telemetry of a Host Asset
Below is the 13-year operational telemetry of a single asset—Golden Goose. Across four GPs and five transfers, its distress beacon cuts right through the vacuum.

Figure 1: The 13-year operational telemetry of Golden Goose. Yellow markers indicate GP-engineered valuation spikes and debt syndication; red markers track the compounding structural friction and operational decay of the host asset.
This graph is an Organisational CT Scan. It provides the visual diagnostic proof that it is entirely possible to track GP skill versus luck over time and map any asset's operational reality accurately, irrespective of the financial narrative.
The X-ray reveals two distinct, conflicting realities:
The Illusion of Value (The Yellow Stars)
GPs engineer massive valuation spikes to extract performance fees and syndicate new debt. Currently, Golden Goose is being saddled with €880M in debt under the HSG buyout, extracting €57M in pure annual interest. (For a complete mathematical breakdown of how this specific debt burden cannibalises the host asset, refer to my real-time diagnosis of the Golden Goose Corporate Doom Loop). The financial engineering works perfectly: the exiting GPs and the investment banks extract their millions and successfully transfer the risk.
The Operational Decay (The Red Stars)
Look beneath the yellow stars. While the financial metrics spike, the host is being systematically hollowed out. This invariant 13-year CT Scan reveals that the asset's oxygen is bleeding out, albeit slowly. As of the latest telemetry, €469M of its 2025 revenue is transacted with customers carrying a 91% probability of churn due to unaddressed root-cause contagion and structural friction.
DIAGNOSTIC DEEP DIVE: > How does a 64% Asset Inefficiency Score collide with €57M in annual interest? Read the accompanying real-time diagnosis to see exactly who wins, who loses, and the mathematics behind the 20% bankruptcy trap: The €880M Golden Goose Bond Sale & The Corporate Doom Loop
The True Cost of 'Shadow Data'
The mechanics of the Private Equity machine are brutally efficient:
The GPs extract the management fees.
The banks extract the syndication fees.
The LPs are left holding debt against a decaying, dying asset in the cold vacuum of the vast, black Outer Space.
Human eyes are biologically limited to the visible spectrum, and standard LP due diligence is no different. It only sees the yellow stars.The operational screams—the red stars—are perfectly clear once you deploy the algorithm required to scan the invisible spectrum of 'Shadow Data’ and display the artefacts. To see the invisible, we simply need new rulers. The panopticon has been built; it is time for the LPs to step into the watchtower.
Real-Time Diagnosis: The €880M Golden Goose Bond Sale & The Corporate Doom Loop
Less than 24 hours after publishing a warning on the “Corporate Doom Loop”, Golden Goose announced an €880M bond sale. This real-time diagnosis breaks down the mathematics of the buyout, revealing how a €57M annual interest burden collides with a 64% Asset Inefficiency Score (AIS). See the clinical proof of how Private Equity debt structures inevitably cannibalise fundamentally decaying assets.
On Tuesday, 14 April 2026, I published a Strategic Advisory Brief detailing the “Corporate Doom Loop”—the 20% bankruptcy trap created when Private Equity layers debt onto fundamentally decaying assets. I used a highly publicised €2.5 billion acquisition as the primary diagnostic case study.
Less than 24 hours later, Bloomberg and the global financial press announced that Golden Goose is marketing an €880 million bond sale to fund that exact acquisition by HSG. The market is measuring the Euribor spread. They are entirely blind to the survival rate.
Inspired by Professor Ludovic Phalippou (Oxford Saïd), whose recent viral post demonstrated how an LLM could decode complex private equity debt structures in seconds, I decided to test the predictive power of my framework in real time.
This morning, I fed my Strategic Advisory Brief and the live market data into ChatGPT, asking it to diagnose the event: How can Golden Goose support its new €880M debt structure under the HSG buyout?
The LLM’s response was a clinical dissection of the “Corporate Doom Loop” playing out in real time:
“They cannot support it without cannibalising the host.”
Running the mathematics on this €880M debt reveals a reality far more severe than a simple 6% interest rate. Here is the clinical breakdown of the burden, and exactly who extracts the value.
1. The Real Mathematics of the €880M Debt
Golden Goose closed 2025 with €734M in revenue and ~€248M in Adjusted EBITDA. Consider the debt funding the HSG buyout:
Floating Rate Tranche: 3-month Euribor (currently ~2.2%) plus 400–425 basis points, yielding ~6.2% to 6.45%.
Fixed Rate Tranche: Yielding in the mid-to-high 6% range.
Blended across the €880M issuance, Golden Goose is saddled with €55M to €57M in pure annual interest.
2. The Collision: Debt vs. The 64% Inefficiency Score
GPs and credit rating agencies justify this debt against the €248M Adjusted EBITDA, assuming stable revenue. The Organisational CT Scan dismantles this assumption.
Diagnostic data shows Golden Goose operates with a 64% Asset Inefficiency Score (AIS). Approximately €469M of its 2025 revenue was transacted with customers carrying a 91% probability of churn due to unaddressed structural friction.
When a customer base bleeds at this velocity, immense marketing capital is spent merely to replace those fleeing. Yet, product innovation is starved because €57M is immediately extracted for bondholders. The CEO must cut costs—cheapening materials or raising prices (see my recent diagnosis of how this exact “Value Engineering” destroyed the 153-year-old Russell & Bromley). This accelerates the ‘Network Jump’ of customer friction, driving churn higher. This is the 20% bankruptcy loop in motion.
3. Who Actually Wins?
Golden Goose will not win; brand equity is hollowed out to service the yield.
There are three winners:
The Exiting GP (Permira): Cashed out LPs at a €2.5B valuation before operational decay destroys the EBITDA.
The Investment Banks: Syndicating the debt to extract millions in upfront fees, transferring long-term risk to bond buyers.
The Acquiring GP (HSG): Extracting management fees whilst using debt to minimise equity at risk.
The losers include employees facing cost-cutting, customers buying degrading products, and Limited Partners (LPs) holding debt against a decaying asset.
Financial markets measure the Euribor spread; I measure the survival rate.
“To see the invisible, we simply need new rulers.”—Morten J. Sørensen
THE STRATEGIC ADVISORY BRIEF
To read the complete mathematical methodology behind this diagnosis, including how Limited Partners can demand Asset Inefficiency Scores (AIS) to protect their capital, read the full 24-page memorandum published yesterday:
Strategic Advisory Brief: Measuring with the Wrong Rulers & Breaking PE’s One-Way Mirror
A 20% bankruptcy rate proves traditional Private Equity due diligence is structurally blind. This Strategic Advisory Brief exposes how GPs engineer ‘Alpha Illusions’—masking a 90% defect rate inside a €2.5B trophy asset—and equips Limited Partners with the diagnostic tools to break PE’s one-way mirror, protect their capital, and reject toxic Continuation Vehicles.

MEMORANDUM TO: Consortium of Limited Partners (Investment Committee)
FROM: Morten J. Sørensen, Founder, Lead Diagnostician & CRO
DATE: 14th April 2026
SUBJECT: The Golden Goose Audit, the 20% Bankruptcy Trap, and Protecting the LP
TL;DR: Private Equity is operating with the wrong rulers, trapping Limited Partners in a catastrophic 20% bankruptcy loop. The biggest losers are the LPs and the everyday people they represent—the firefighters, teachers, and civil servants whose capital is locked inside decaying assets rubber-stamped by antiquated due diligence. An LP armed with the Organisational CT Scan would have instantly recognised the €2.5 billion Golden Goose acquisition not as a trophy asset, but as a decaying liability—empowering them to reject Continuation Vehicles (CVs), decline Co-Investments, and hold the GP strictly accountable. Forensic diagnostic data proves it was an ‘Alpha Illusion’ engineered to mask a 90%+ product defect rate, a conclusion drawn from interviewing 939 actual customers across 54 different countries.
For the past decade, the definitive diagnostic mandate has been to step beyond the standard ‘Streetlight Effect’ of financial reporting, seeking to understand the ‘why’ and to quantify the unmodelled operational realities that silently hollow out enterprise value.
Consider the established medical ‘playbook’ for chronic metabolic conditions, such as Type 1 Diabetes. The standard protocol historically dictates a prescribed diet of 360 grams of carbohydrates daily. This regimen mathematically guarantees hyperglycaemic spikes, just as the massive insulin doses required to counteract them guarantee hypoglycaemic crashes. Both extremes silently hollow out the human body from the inside. This is the playbook roller-coaster patients are expected to endure—a system where losing a limb is considered an ‘acceptable outcome’ long-term. It is a playbook that literally prescribes the exact kryptonite that destroys the host.
If a patient rejects this ‘normal’ and forces the administration of a simple, fast, non-invasive Coronary Artery Calcium (CAC) Scan to prove internal health, the empirical reality shatters the establishment’s assumptions. Yet, 99% of the medical ecosystem is uninterested. They unquestionably follow the accepted protocol because the truth sits outside their ‘Streetlight Effect’—a differing reality that does not make the industry money. The system is rigged in their favour, providing them with plausible deniability and liability cover.
When this same diagnostic lens is applied to corporate assets, the exact same rigged system emerges. Private Equity’s vast, invisible network manipulates assets to serve GP incentives rather than the asset’s actual health. GPs use debt, manipulate the Internal Rate of Return (IRR), and ride market tailwinds to simulate ‘Alpha’. Like doctors strictly adhering to a destructive protocol, they follow a global playbook that enriches the system whilst destroying the host, relying on opaque shadow data to hide the reality. The financial painkillers they administer temporarily mask the symptoms, but ultimately lead to corporate amputation (a 20% failure rate). No one can penetrate the exterior of this well-guarded house of one-way mirrors.
The Schrödinger’s Cat of Private Equity
FIGURE 1: The PE Quantum Paradox: Traditional external metrics blur the internal operational reality of the Opaque Black Box, leaving LPs in a state of profound ambiguity.
Too often, assets within private equity portfolios operate within an Opaque Black Box. This creates a valuation paradox akin to Schrödinger’s Cat: the asset’s true operational state exists in a state of profound ambiguity. Is it genuinely ‘Alive and Thriving’, or is it quietly ‘Dead and Deteriorating’ beneath the surface? External metrics and standard P&L show only the visible exterior of the Opaque Black Box, masking the true internal health until that ‘box’ is diagnostically opened.
Golden Goose existed in this exact quantum state. To answer the challenge posed by Professor Ludovic Phalippou (Oxford Saïd)—How much genuine operational value creation are we truly seeing?—the industry must scan the unopened box. By applying an Organisational CT Scan to the recent €2.5 billion acquisition, the thirteen-year ambiguity collapses, and true operational skill is finally separated from market luck.
The Cost of Institutional Blindness
Based on 2025 financial results, institutions pay ‘world-leading’ macro-risk and ESG data providers through a lucrative hybrid model comprising recurring software subscriptions and asset-based fees. For the industry’s top provider alone, a Total Run Rate reaching $3.3 billion translates to an average blended expenditure of roughly $460,000 per client.
For the largest asset managers and LPs, these fees scale into the millions. Yet, LPs are spending this capital to model macroeconomic weather whilst entirely ignoring the operational holes in the Opaque Black Box.
Despite this massive expenditure on data, PE-backed companies face a catastrophic 20% bankruptcy rate over the past decade. In 2024 and 2025, PE firms were involved in over 50% of the largest U.S. corporate bankruptcies. How can Limited Partners spend millions on ‘valuable’ risk reports and still end up holding an empty box?
Because traditional P&L metrics, EBITDA multiples, and standard ESG frameworks use the wrong rulers to measure operational value creation. They look only where the streetlight shines, measuring the extraction of value in the past whilst suffering from inattentional blindness to the real-time erosion of asset integrity in the present.
When the empirical reality of this erosion is finally placed on the boardroom table, the instinctual reaction of the establishment is denial. The most expensive sentence a boardroom can utter is, ‘I do not believe it.’ That reflex of disbelief is exactly what funds the 20% bankruptcy trap.
If Limited Partners are to stop funding this illusion and uncover true operational health, the industry must abandon its denial and break the one-way mirror of Private Equity.
Like a CAC Scan, the Organisational CT Scan takes an internal snapshot of an asset’s Shadow Data, and illuminates the unseen plaque (breadcrumbs). Its objectivity is absolute, and its reach is boundless. Tactically, LPs can independently deploy this diagnostic to audit Continuation Vehicle (CV) pitches, vet direct Co-Investment opportunities, or instantly stress-test a GP’s existing portfolio before committing capital to their next fund—without ever needing access to the GP's sanitised data room.
Strategically, however, its implications are far more disruptive: the CT Scan can retroactively map an asset’s operational Alpha back across decades. This longitudinal tracking leaves every historical PE holding, every past exit, and every GP’s established track record entirely vulnerable to being ‘seen’ and their operational Alpha scores certified.
By applying this invariant longitudinal framework to Golden Goose, we are able to track the asset's true organisational homeostasis across its past five PE transfers over 13 years. The GP’s curated narrative is stripped away, leaving only the unvarnished operational reality.
1. The Corporate Doom Loop: Appeasing the Spreadsheet
In the modern LP landscape, the core crisis is the inability to distinguish genuine systemic value creation from destructive, debt-driven margin extraction.
The market recently witnessed the fatal conclusion of this exact playbook with the 153-year-old British heritage brand, Russell & Bromley. A company that survived two World Wars and the Great Depression was liquidated in a £2.5 million pre-pack sale. Why? Because leadership chose appeasement. To protect margins, they engaged in ‘Value Engineering’—swapping heritage materials for cheaper substitutes. They traded a century of trust for short-term margin protection, triggering a Corporate Doom Loop: lower quality reduced customer loyalty, which led to further cuts, and accelerated decline.
Golden Goose has been walking this exact same precipice. In October 2022, Golden Goose’s then-owner, Permira, acquired its main supplier. This vertical integration was presented as operational value creation. In reality, it was pure financial engineering designed to service massive LBO debt (€480 million in Senior Secured Notes).
To protect the company’s 34% EBITDA margin against rising costs, the GP appeased the spreadsheet and compromised luxury-grade longevity. Traditional metrics completely hid this product destruction; Adjusted EBITDA scaled flawlessly to €248.3 million by 2025.
However, the thirteen-year Longitudinal Diagnostic Continuity Asset Efficiency Score (AES) tracked a different truth. Following the 2022 integration, the brand suffered a catastrophic AES collapse—a longitudinal -64.6% Alpha Decay since the 2013 baseline asset transfer cycle. This collapse was driven by a surge in structural product failures (soles detaching in months). Robust EBITDA without underlying operational integrity is merely a lagging indicator masking severe asset decay. It has since stabilised but currently runs at a 25% lower operational Alpha than 13 years earlier.
FIGURE 2: The Alpha Illusion: As Golden Goose’s reported Enterprise Value surged to €2.5 billion, its underlying Asset Efficiency Score (AES) collapsed by 64.6%.
2. The C-Suite Illusion: Fixing Symptoms with Job Titles
For the past decade, the Organisational CT Scan has been utilised not merely to audit historical performance but to map Shadow Data and accurately predict the inevitable failure of incoming CEOs, Creative Directors, and highly publicised M&A and turnaround strategies.
When an asset’s fundamental ‘plaque’—the persistent, unaddressed breadcrumbs of customer friction, such as Golden Goose’s 13-year history of structural product defects—is finally illuminated, a stark truth emerges: the underlying strategy of the General Partner is fundamentally flawed. Because standard due diligence completely misses these historical root causes, the unpriced Enterprise Value remains permanently locked.
How is this empirically proven? By mapping an organisation’s open job requisitions or a new executive’s ‘Transformation Masterplan’ directly against the actual CT Scan’s friction points destroying revenue and margin.
When a new CEO is installed to reposition a lagging asset, they inevitably broadcast a strategic masterplan detailing how they will succeed where their predecessor failed. However, when this new mandate is cross-referenced with the CT Scan’s diagnostic data, the strategic gap becomes glaringly obvious. The board is actively hiring to fix visible financial symptoms, whilst the actual root-cause contagions—poor product quality, hostile return policies, or severely degraded service levels—remain entirely absent from the hiring strategy and the boardroom agenda.
Replacing the C-suite without measuring this underlying friction is akin to placing a new captain on a vessel with a structurally compromised hull. Because the new CEO’s strategy is entirely misaligned with the actual friction hollowing out the asset, their tenure will have zero impact on the long-term health of the brand. A new CEO cannot save an asset if their mandate (LTIPs) remains to appease the spreadsheet rather than repairing the hull.
FIGURE 3: The Corporate Hot Potato: 13 years of unaddressed root-cause friction (structural product failures) passed across four successive Private Equity owners.
3. The One-Way Mirror & Gestalt Closure
Because internal operational friction is hard to measure as an external ‘observer’, GPs easily hide behind opaque shadow data. Analysts look at active users and EBITDA margin expansion and instinctively fill in the blanks—a classic case of Gestalt Closure. They project complete operational health.
To shield Golden Goose’s multi-billion-euro valuation from the reality of its decaying product, the GP weaponised an automated positive feedback system in 2021. By aggressively sending review invitations immediately after purchase, they harvested the ‘euphoric phase’ of the luxury retail experience to artificially inflate 5-star reviews to 93%—a figure that is statistically impossible to reach organically.
Herein lies the structural paradox: the frontline staff were selling the legacy, but the boardroom’s strategy had already broken the product. The 5-star reviews and interviews overwhelmingly praised the impeccable in-store assistants. This engineered a digital ‘Halo Effect’—a one-way mirror designed to deceive the market. By forensically triangulating the asset’s Shadow Data against its actual root-cause friction, the CT Scan shatters this glass. It bypassed the manipulated point-of-sale data, revealing that whilst the GP-reported valuation scaled to €2.5 billion, the unprompted reality was that 85% of interview feedback by 2024 consisted of 1-star warnings of product failure. This has remained the asset’s top-five root cause since 2013, yet it has never been addressed.
4. Organisational Homeostasis & The Farfetch Warning
If Enterprise Value expands but the Delta AES{Variance} collapses, the outperformance is mathematically proven to be market luck (The Alpha Illusion).
This illusion creates a massive liability for LPs entering Continuation Vehicles (CVs): the Ghost Economy Deficit (GED).
In 2025, Golden Goose generated €734 million in revenue, but its Asset Inefficiency Score (AIS) hit 64%. Therefore, an astonishing ~€469 million of that top-line revenue was transacted with customers carrying a 91% probability of churn.
Whilst the acquiring PE firm technically takes ownership of the asset, it is the Limited Partners who inherit the financial liability of the ‘lemon’. For LPs prioritising Realised Cash (DPI), exposure to this €469 million GED means their capital is trapped in Organisational Homeostasis. The new General Partners are forced to burn immense amounts of the fund’s equity and marketing capital simply to maintain a broken equilibrium, frantically acquiring new customers to replace the massive cohort actively fleeing the brand.
To understand the mechanics of inheriting this deficit, look to the catastrophic collapse of Farfetch.
In early 2021, Farfetch commanded a peak valuation of ~$24 billion. Two years later, it suffered a 99% shareholder wipeout. Conventional post-mortems blame disastrous M&A, but those were merely symptoms. When a forensic diagnostic scan calculated Farfetch’s AIS, it was operating at a critical 51.9% prior to its implosion. The friction broke the unit economics, which broke the cash flow, which ultimately broke the multiple. Golden Goose is holding a 64% AIS. The public markets do not pay premium multiples for standard operations; they pay for frictionless velocity.
5. The Network Jump: The €1.74 Billion Tea Light
Standard compliance due diligence completely misses the modern, digital-age threat known as the Small-World Network Jump—the exact moment internal friction breaches the financial façade.
In a confidential turnaround mandate audited by my firm, a global retailer celebrated a major financial victory: reformulating a key ingredient to reduce transportation costs annually by €42 million. Leadership celebrated the margin expansion. However, the reformulated product was 70% less efficient in actual use. Customers felt betrayed by the broken promise.
That tiny ‘breadcrumb’ of betrayal did not stay local. The Small-World Network operates ruthlessly. It spread via Strong Ties, took a Global Shortcut via Weak Ties, and jumped from cluster to cluster. The result? That initial €42 million saving directly led to €1.74 billion in lost customer revenue.
For Golden Goose, such a network jump materialised when prominent YouTube channels physically dissected their €500 sneakers on camera, exposing interiors made of ‘fibreboard and compressed cardboard’ to over 680,000 viewers. Multiply that by 15, and the contagion infects over 10 million potential customers. In the age of social media, this jump scales higher and faster, changing the metric from a closed network to a massive public audience in seconds. It is an uncontrollable jump, and it is impossible to defend.
FIGURE 4: The Network Jump: How a €0.02 operational "efficiency" triggers a €1.74 billion contagion across a highly connected customer ecosystem.
Conclusion: Sovereign Capital and the New Rulers
No asset—regardless of a 153-year heritage or a multi-billion-euro valuation—is immune to the physics of operational decay, the true ‘Invisible Gorilla’. Heritage offers no protection from reality.
When a highly-leveraged asset defaults and goes bankrupt, who is the biggest loser? The empirical data provides the definitive answer. The Panopticon watches, silently, every PE and GP to protect the LPs.
It is rarely the General Partner. The GP collects their 2% management fees, leverages multiple arbitrage to execute the exit, and passes the ‘empty’ box to the next buyer. As Associate Professor Kyle Welch (GWU) astutely noted:
“Who protects pension fund recipients FROM pension fund managers and private equity? ANSWER: nobody. Pension fund managers and private equity fund managers have more incentive alignment than pension fund managers do with their pension recipients.”
The biggest loser is the LP, and ultimately, the everyday people they represent—the firefighters, teachers, and civil servants whose capital is locked inside decaying and empty assets rubber-stamped by antiquated due diligence. An LP armed with the Organisational CT Scan would have instantly recognised the €2.5 billion Golden Goose acquisition not as a trophy asset, but as a decaying liability—empowering them to reject Continuation Vehicles (CVs), decline Co-Investments, and hold the GP strictly accountable. The forensic diagnostic data proves it was an ‘Alpha Illusion’ engineered to mask a 90%+ product defect rate.
How LPs Must Protect Themselves
As a partner at Roland Berger recently noted, “finding new, practical ways to create value for my clients every day” is a formidable challenge. How can a firm consistently uncover greater value than its competitors when the industry relies upon standard due diligence playbooks that are structurally blind to the ‘Invisible Gorillas’—the massive financial leaks hiding in the gap between a boardroom's strategic promise and the customer's actual experience?
FIGURE 5: The €800M Invisible Gorilla: Breaking the one-way mirror requires shifting from symptom-based financial reporting to diagnostic accountability.
Standard due diligence is dead. As Professor Ludovic Phalippou recently observed during a rigorous Oxford financial role-play, a large language model (LLM) can now generate near-perfect debt capacity analysis and negotiation strategies in seconds. The AI operated flawlessly within the illuminated circle of provided data.
Historically, LPs and GPs have relied upon elite advisory firms to generate these standard Commercial Due Diligence (CDD) reports, often using them as a mechanism of institutional cover. But if an algorithm can perfectly execute standard due diligence based on visible data, then conventional CDD is entirely commoditised. Standard diligence can structure a deal, but it cannot scan inside the asset’s Opaque Black Box to reveal its untapped value or hidden friction.
If LPs are to be protected from the 20% bankruptcy trap, they must stop outsourcing their conviction to commoditised playbooks designed merely to rubber-stamp transactions. Instead, LPs must mandate diagnostic accountability. By measuring the Asset Inefficiency Score and executing the Asymmetrical EV Recovery Bridge, capital allocators can force GPs to move from masking symptoms to engineering genuine operational health.
The financial mathematics serves as empirical validation, but the profound reward is structural resilience. When capital allocators know the true operational health of their assets, they insulate their portfolios from macroeconomic shocks. A structurally sound asset with frictionless unit economics survives global instability; an asset propped up by financial engineering and a 90% defect rate collapses under it. Knowing the difference is what restores sovereignty to the capital provider.
To see the invisible, the market simply needs new rulers.
The precise methodology for calculating the Ghost Economy Deficit, mapping the Network Jump, and deploying the Organisational CT Scan is declassified in Who Moved My Customers? LPs who demand these diagnostic frameworks will possess the empirical tools to finally separate genuine Alpha from engineered illusions.
The Panopticon is now active, and the central observation tower is dark. GPs will never know when their Shadow Data is being audited—which means they must operate as if it always is.
Equip yourself.
Measuring The Unmeasurable: Breaking the One-Way Mirror of Private Equity
Drawing a profound parallel between a flawed medical playbook and the Private Equity industry, this article exposes how standard financial metrics mask the hollowing out of enterprise value. Discover how the Asset Efficiency Score (AES) provides an independent, mathematically verifiable ruler to break PE's one-way mirror, empowering LPs to bypass rigged data and isolate true GP skill from mere market luck.
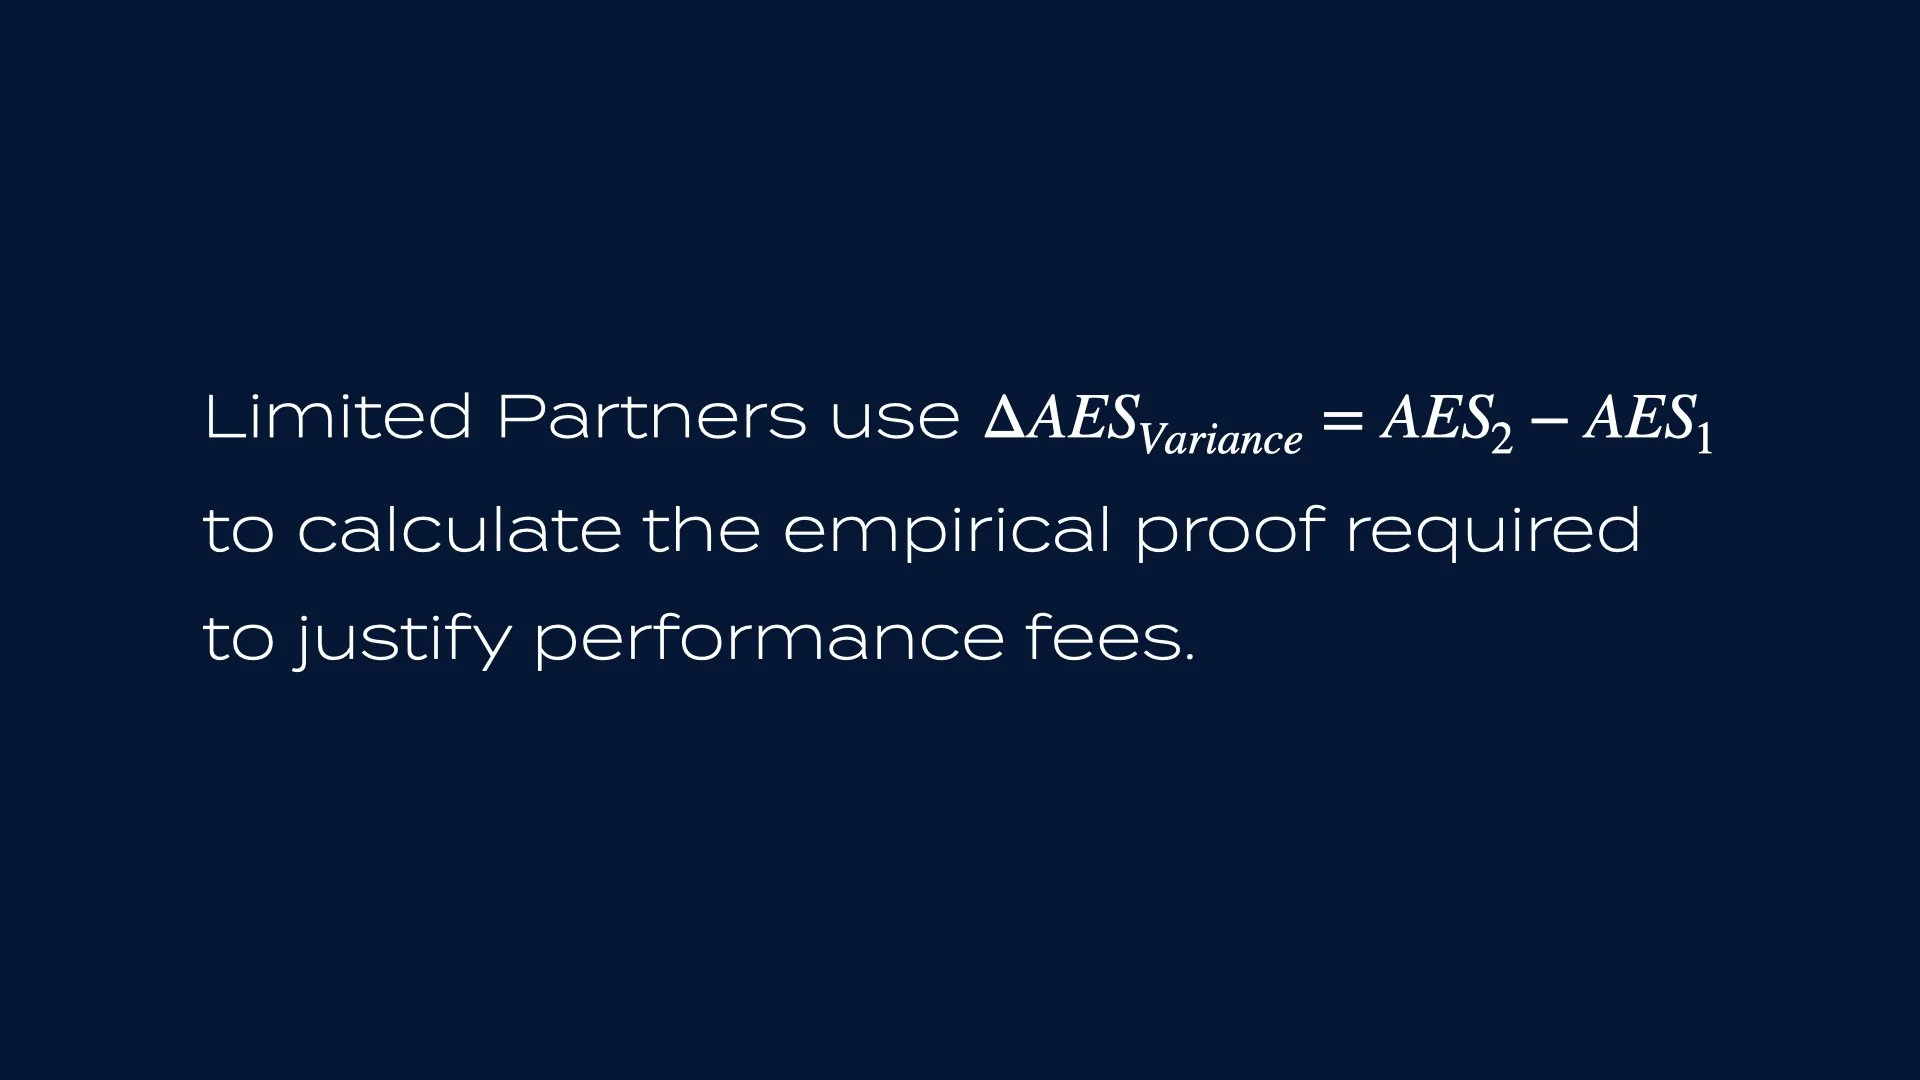
For the past decade, my work has been purely diagnostic—stepping beyond the standard 'Streetlight Effect' of financial reporting to quantify the unmodelled operational realities that silently hollow out enterprise value. I built the Organisational CT Scan to reverse-engineer these hidden mechanics, helping teams anchor due diligence in measurable friction recovery rather than just treating surface-level metrics.
It is the difference between handing a management team a financial painkiller to temporarily mask the symptoms, versus isolating the root-cause contagion that is actually hollowing out the host.
This relentless focus on exposing the 'unseen' didn't start in a boardroom. It is deeply personal.
For 40+ years, I have lived with Type 1 Diabetes. The established medical 'playbook' dictated I eat 360 grams of carbohydrates daily. This prescribed diet guarantees hyperglycaemic spikes, just as the massive insulin doses required to counteract them guarantee hypoglycaemic crashes. Both extremes silently hollow out the human body. This is the 'playbook' roller-coaster we are expected to endure—where losing a limb is considered an acceptable outcome. It is a playbook that literally prescribes the exact kryptonite that destroys the body. I had to know why.
Just over ten years ago, I rejected this 'normal'. I questioned the truth and reverse-engineered how the system evolved over a century to define the playbook they blindly follow today. When I finally pushed against the system and forced my doctors to give me a simple, fast, non-invasive CAC Scan—a Coronary Artery Calcium (CAC) scan is a non-invasive, low-dose CT scan that measures the amount of calcified plaque in the heart's arteries, providing a score that helps predict future heart attack risk—to prove my internal health, the results shattered their assumptions.
Yet, 99% of the medical ecosystem isn't interested because the truth sits outside their 'Streetlight Effect'—a truth that doesn’t make the industry money. They blindly follow the prescribed 'accepted' lie. The system is rigged in their favour, giving them plausible deniability and liability cover.
The Private Equity Playbook
At the exact same time I began applying my diagnostic lens to corporate assets, I saw the exact same rigged system.
I saw Private Equity’s vast, invisible spider’s web influencing and hollowing out the brands everyday people use—manipulating those assets to serve General Partner (GP) incentives rather than the asset's actual health. The Private Equity industry is structurally misaligned. Taking on a trillion-dollar industry means facing an establishment that desperately needs the current narrative to remain true.
GPs use debt, manipulate IRR, and ride market tailwinds to simulate 'Alpha'—charging astronomical ‘2 and 20’ fees for what is actually just market 'Beta'. Like my doctors over the years, they are following a global playbook that enriches the system while destroying the host, relying on opaque shadow data to hide the reality.
“To see the invisible, we simply need new rulers.” — Morten J. Sørensen
Because internal emotional and operational friction is hard to measure, GPs easily hide behind this shadow data. Without a new ruler for operational reality, Limited Partners (LPs)—the pension funds and sovereign wealth funds supplying the capital—cannot verify if a GP actually generated true value (Skill) or simply rode a wave of leverage and market tailwinds (Luck).
It is time to break the one-way mirror of Private Equity.
The Diagnostic Baseline (AES)
If we are to isolate GP skill, we must measure unseen operational reality, not just financial outputs. A personal cardiac CT scan—revealing internal homeostatic health long before external symptoms appear—sparked the Genesis breakthrough.
Using this concept, we can establish an independent, externally verifiable Asset Efficiency Score (AES). Its inverse, the Asset Inefficiency Score (AIS), quantifies the exact volume of unpriced value actively trapped within a company's human and operational friction, transforming it into a measurable metric:
This establishes an uninfluenced, true operational baseline of the asset—completely independent of its financial market valuation and, crucially, agnostic of the GP's self-reported data.
The Hypothesis: The Variance of Skill
Since we can measure an independent operational baseline friction, we can isolate the GP's actual impact without relying on their data room.
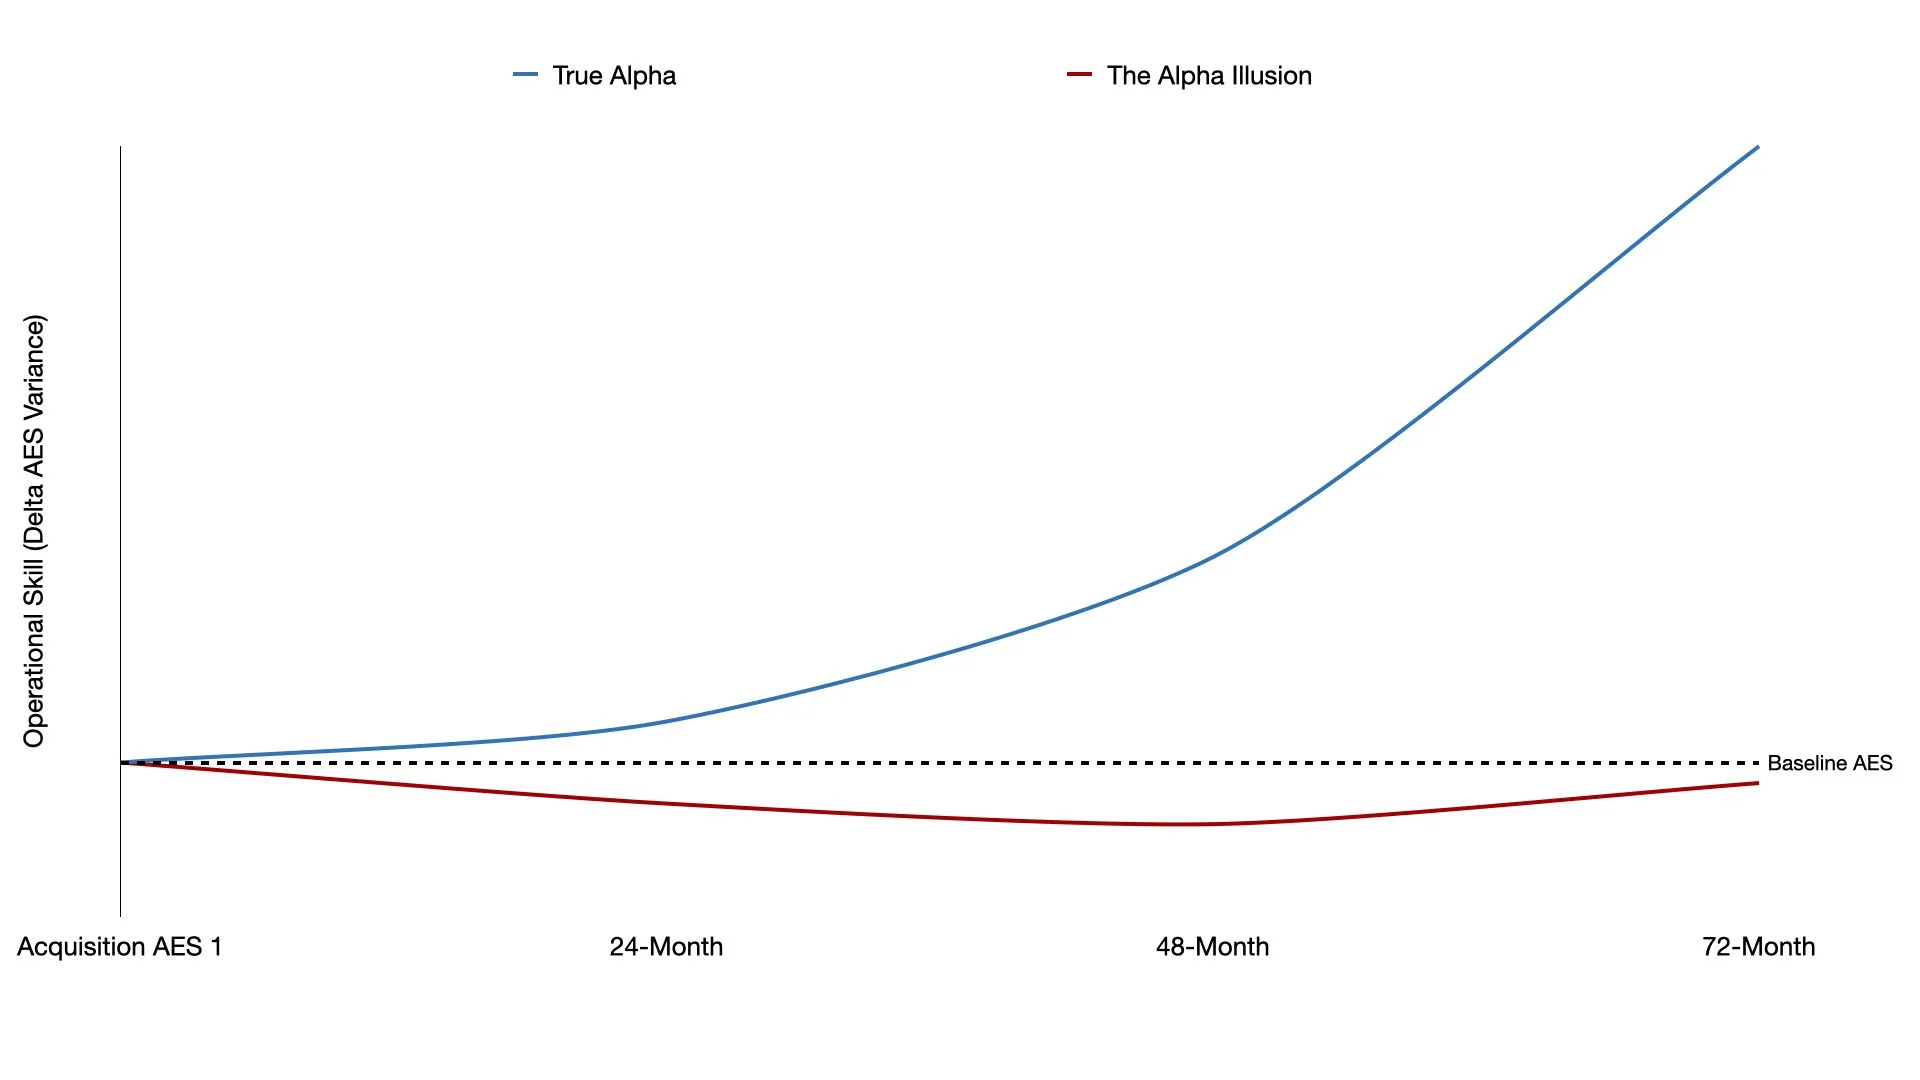
We establish the baseline prior to GP intervention (AES 1) and conduct secondary scans during and following their ownership period (AES 2). That longitudinal variance mathematically strips out market noise to reveal true operational skill and value creation:

Protecting the LPs: The Implication of the Ruler
By measuring Delta AES_Variance, we effectively strip away market exit multiples (M) and sector Beta.
The Alpha Illusion: If Enterprise Value expands but Delta AES_Variance remains static, the outperformance is mathematically proven to be market luck. The GP did not fix the asset; they just held it, manipulating the balance sheet while charging astronomical fees.
True Alpha: A positive Delta AES_Variance isolates true, proprietary skill, providing the missing empirical proof required to potentially justify performance fees.
Because the AIS exposes strictly hidden, trapped EBITDA, resolving this friction is a positive-sum value creator flowing directly into unpriced EV.
The Retroactive Audit: Nothing is Safe
Crucially, because this diagnostic is completely agnostic and externally verifiable, it bypasses the GP's shadow data entirely. LPs no longer have to ask the GP for permission to understand the health of their own capital.
But the implications go far beyond active portfolios. Because the diagnostic relies on independent, uninfluenced metrics, LPs can retroactively build a GP’s historical AUM performance chart. They can effectively audit a GP's legacy funds to mathematically prove whether past ‘Alpha’ was generated by operational skill or merely fuelled by low interest rates and financial engineering.
Nothing is safe from the possibilities of an Organisational CT Scan.
We cannot fix a rigged system by asking the architects of that system for their data. To see the invisible, we simply need new rulers.
The €4.92 Billion Blind Spot: A Forensic Diagnostic of Vinted’s Pre-IPO Enterprise Value
As Vinted targets an €8 billion pre-IPO valuation, traditional due diligence is missing a €4.92 billion structural leak. By applying the Organisational CT Scan and introducing friction-adjusted mathematics (LTV_{real}), this forensic diagnostic reveals how Vinted’s 54.6% Asset Inefficiency Score mirrors the catastrophic collapse of Farfetch—and how advisory firms can mathematically underwrite the recovery.

The most expensive sentence a boardroom can utter is, ‘We do not believe it.’
In their 2026 Global CFO Survey, FTI Consulting issued a stark reality check for the private equity and M&A landscape, noting that the next era of dealmaking will reward discipline, outstanding execution, and delivery over deal sourcing or pace. They warned that organisations getting due diligence or integration wrong are almost certain to fail, emphasising that true value creation requires anchoring diligence in data, designing integrations around measurable value, and aligning governance with performance outcomes.
They are absolutely correct. The era of easy multiple arbitrage is dead. However, the advisory market is presently suffering from its own 'inattentional blindness'—staring so intently at archaic due diligence playbooks that it overlooks the systemic inefficiencies standing directly in front of it. Outcomes that appear impossible are often entirely within reach; they simply require new rulers to measure them.
Vinted Group is currently in the exploration stages of a secondary share sale that would value the business at approximately €8 billion—a €3 billion increase in just one year—serving as a strong precursor signal for a potential IPO. To many, Vinted’s financial trajectory is a flawless, unbroken circle of value creation. Operating purely under the 'Streetlight Effect', the market applauds a perfect, textbook cap table evolution:
The Unicorn Milestone (Nov 2019): €128M from Lightspeed, breaching the €1B Enterprise Value (EV) mark.
The Infrastructure Play (May 2021): €250M from EQT Growth, driving EV to €3.5B to build out vertical logistics and payments.
The Profitability Marker (Oct 2024): A €340M secondary led by TPG, confirming a €5B EV as a liquidity event rewarding the shift to profitability.
The Pre-IPO Signal (Current): Targeting an €8B EV.
Building a European-based, digital C2C infrastructure capable of commanding an €8 billion valuation is a monumental achievement and should rightly be celebrated. However, in the high-stakes world of private equity and 'growth-at-all-costs' burn-outs, pre-IPO Decacorns often exist as financial Schrödinger’s Cats. Until their operational perimeter is fundamentally reported and audited beyond standard financial reporting, they are simultaneously thriving on paper and quietly eroding in reality.
When an advisory firm deploys an ‘Organisational CT Scan’ across Vinted’s ecosystem, a massive, structural blind spot becomes visible within the ‘Shadow Data’. The asset is currently, pre-IPO, obscuring €4.92 billion in unpriced Enterprise Value.
For the advisory practice capable of mathematically quantifying this invisible leak, the traditional commoditised project model—reliant upon hourly rates and fixed-fee contracts—becomes an antiquated approach. Transitioning from linear consulting fees to underwriting a €13+ billion value proposition via a performance-based mandate represents the next structural evolution of advisory.
To see the invisible, we simply need new rulers.
The Fragility of the 65x Multiple: The Farfetch Warning
To understand the mechanics of underwriting this €4.92 billion delta, one must first understand the severe fragility of Vinted's current valuation. Vinted’s confirmed €5 billion secondary and proposed €8 billion IPO target imply an EV/EBITDA multiple hovering between 50x and 65x.
The public markets do not pay a 60x premium for standard operations; they pay exclusively for frictionless velocity and compounding network effects that promise exponential future cash flows. This hyper-growth multiple becomes a fatal liability the moment it disconnects from operational reality.
We need only look at the catastrophic collapse of Farfetch to witness the terminal velocity of a broken operational core. In early 2021, Farfetch commanded a peak valuation of ~$24 billion on the promise of becoming the 'Amazon of luxury'. Two years later, it suffered a 99% shareholder wipeout and a distressed $500 million rescue takeover by Coupang.
Conventional market post-mortems attribute Farfetch's demise to disastrous M&A activity (such as the New Guards Group acquisition) and a sudden departure from its asset-light model. However, these strategic shifts were symptoms, not the root cause. Farfetch’s board was forced into unsustainable capital allocation to mask a decaying core. Operating under a strict 'growth-at-all-costs' mandate, the underlying operational friction eroding their unit economics remained unaddressed. High return rates, systemic customer churn, and structural platform inefficiencies created a massive, un-modelled drag on Customer Lifetime Value (LTV).
When operational friction (F) is ignored, the true value of the customer base collapses. The mathematical reality of their unit economics looked closer to this:
To compensate for this decaying LTV_{real}, Farfetch deployed relentless marketing spend and reactive M&A simply to replace the users they were bleeding.
The mathematics of this collapse are not an anomaly; they are a measurable output. When a forensic operational diagnostic calculates the Asset Inefficiency Score (AIS)—the precise proportion of baseline revenue actively eroded by internal friction, churn, and replacement CAC—Farfetch was operating at a critical 51.9% AIS prior to its implosion. The friction broke the unit economics, which broke the cash flow, which ultimately broke the multiple.
When that exact same diagnostic is applied to Vinted’s current ecosystem, the verified AIS sits at an unsustainable 54.6%.
Vinted is presently carrying a heavier internal friction drag than Farfetch did immediately prior to its terminal correction. Farfetch proves a harsh reality for the private equity landscape: robust top-line GMV cannot sustain a 65x multiple if the underlying unit economics are quietly bleeding out through unmeasured operational friction.
The Shortfall of PEPI Methodology & The Gestalt Illusion
Standard Commercial and Operational Due Diligence (CDD/ODD) can only respond to the limits of the data illuminated by the ‘Streetlight Effect’. Analysts who look at Vinted see an impressive funding timeline and instinctively fill in the blanks—a classic case of Gestalt Closure. They see active users, GMV growth, and margin expansion, and they project complete operational health: an asset in perfect Organisational Homeostasis.
Using old rulers, they cannot measure the invisible emotional friction; it remains intangible, yet very real. A customer’s ‘gut feeling’ is not a qualitative metaphor; it is a highly leverageable financial metric.
If a diagnostic team audits Vinted's 'Shadow Data', a symptomatic operational vulnerability identical to the early stages of the Farfetch decline is revealed. The platform faces systemic, well-documented complaints regarding sellers masking adult content, third-party explicit links, and predatory user behaviour beneath innocent-looking listings. That is on top of customer churn, high returns, and a relentless marketing burn required to mask the friction. Vinted’s response—a reactive, 'zero-tolerance' policy that relies on manually deleting accounts after the damage is done—is the textbook definition of symptom-based management.
The absolute financial cost is the silent exodus of legitimate, high-value customers. They do not abandon the platform because the core C2C concept is flawed—it is, in fact, structurally sound and highly scalable; they simply do not return due to an accumulated, compounding displeasure with processes and user friction. It takes mental effort and time to find what they are looking for, followed by the anxiety of questioning whether the transaction is genuine. That ‘gut feeling’, an emotional trigger, warns them that something is not quite right. Eventually, they lose trust. They may not immediately be able to put a finger on it; however, these invisible frictions evade standard CDD/ODD entirely, yet they compound an unseen fragility within the asset. It can be defined as the asset’s Integrity Tax.
Because Vinted is fundamentally a modern, technology-driven organisation with access to best-in-class resources, these intangible customer disconnects are entirely solvable—provided they are measured.
If viewed as an integrated autonomous technology ecosystem, it can be observed that true customer excellence is not born from patching isolated, disconnected parts. It is derived from the flawless, end-to-end integration of hardware, technology, and software—ensuring all layers, from base infrastructure up to the user interface, are engineered together as a single, cohesive ecosystem. This frictionless execution organically builds and strengthens Customer Lifetime Value (CLV) metrics.
Vinted possesses the skills, capital, and structural capacity to orchestrate such a seamless, self-healing technology stack that proactively operationalises a flawless, untouchable customer experience.
The 'Small-World Network' operates ruthlessly—every delayed refund, lost package, fraudulent listing, and broken customer promise acts as a root-cause contagion, any of which may jump the network at any time and, much like Farfetch, destroy the asset’s future Enterprise Value in an instant.
Transitioning Advisory Models: The €4.92 Billion Valuation Bridge
Vinted’s €4.92 billion in unpriced Enterprise Value is not a theoretical premium; it is the direct mathematical output of unrecovered EBITDA subjected to a hyper-growth multiple. Standard PEPI (Private Equity Performance Improvement) playbooks fail to capture this because they audit the P&L as reported, rather than calculating the baseline revenue actively destroyed by systemic operational friction.
For an advisory firm equipped to measure this friction drag—specifically, the Asset Inefficiency Score (AIS)—the commercial model fundamentally changes. By providing the exact operational coordinates required to unlock this EBITDA, advisory teams can decouple their revenue from fixed-fee linear consulting and underwrite performance-based mandates that share in the valuation upside.
The €4.92 billion arbitrage is unlocked through a two-lever mathematical bridge:
To capture this delta, the operational interventions are stark and quantifiable:
1. Halting the Churn Multiplier (The EBITDA Recovery Lever)
When Vinted loses a user to platform friction (measured at a 54.6% AIS), the financial damage is not merely lost future GMV. It is the hard OpEx and marketing capital repeatedly expended to reacquire lost cohorts. This creates a severe EBITDA-to-FCF conversion drag. By engineering a frictionless, vertically integrated ecosystem that suppresses this churn, the platform dramatically reduces Customer Acquisition Cost (CAC) and customer support overhead. This recovered capital drops directly to the EBITDA line.
2. Activating the B2B Revenue Engine (Margin Expansion)
The current architecture operates without capturing an adjacent, high-margin B2B revenue ecosystem. By leveraging Vinted's existing C2C infrastructure (logistics, payments, user base), the platform can seamlessly activate a B2B channel without diluting its core offering. This transitions the asset from a purely transactional marketplace into a high-margin annuity, injecting net-new, high-yield EBITDA into the valuation model.
3. The Multiple Stacking Effect
In a standard business, recovering €75 million to €100 million in EBITDA represents a solid operational win. However, within a pre-IPO Decacorn commanding a ~60x multiple, that same operational recovery mathematically generates billions in unpriced Enterprise Value.
Aligning these recovered operational realities with the current market multiple is the exact mechanism that unlocks the €4.92 billion. By identifying and executing this bridge, the advisory firm ceases to be an expense on the balance sheet and becomes a direct catalyst for multiple arbitrage.
The Diagnostician's Verdict
The observation that Vinted’s ‘Shadow Data' lacks systemic orchestration perfectly validates the institutional warnings issued by global leaders like FTI Consulting. As they correctly noted, organisations that get diligence and integration wrong are ‘almost certain to fail’.
True value creation cannot rely solely on the surface metrics of what is working; it requires anchoring diligence in the unmodelled operational realities of what is quietly eroding. It requires designing integrations around measurable friction recovery and aligning governance directly with de-risked EBITDA expansion.
Outcomes that appear impossible are often entirely within reach. A €4.92 billion arbitrage opportunity—and the transition to value-share mandates—cannot be captured by looking under the same streetlight as your competitors.
The full 35-page declassified forensic breakdown of Vinted's €4.92 Billion Alpha Key™ has been made available for peer review and methodological validation. Inside are the precise execution coordinates detailing how to open the Opaque Black Box, bypass generic symptom management, and recover this trapped Enterprise Value.
Link to Download the Full 35-Page Vinted €4.92 Billion Alpha Key™ PDF
(Reverse-engineer the mathematics. If the 'Shadow Data' sparks curiosity on how your diagnostic teams can stack operational gains into valuation multiples within your own portfolio—or how to transition from linear CDD models to asymmetrical, performance-based Diagnostic Alpha—reach out. Coffee is on me in Amsterdam).
The Streetlight Effect in Energy: Why Fragmented ROI Keeps You Vulnerable
What happens when a diagnostician applies the Organisational CT Scan to a 120-year-old family home? Conventional wisdom and fragmented metrics predicted financial ruin. But by looking beyond the Streetlight Effect, discover how an interconnected €30,000 energy matrix transformed from a perceived liability into a compounding asset, yielding true energy sovereignty and a 6.8-year systemic ROI.

That was exhilarating. What happens when a diagnostician turns the Organisational CT Scan upon their own family home? Waiting twelve months to absolutely find out whether you were right, or if you simply threw away the family fortune.
I recently analysed our 1907-built house as a living system. The objective was to eradicate tangible geopolitical risks, mitigate financial friction, and engineer a profoundly more resilient and welcoming environment.
A year ago, we deployed considerable capital into a tripartite energy matrix: a 20 kWh home battery, a 25-panel solar array, and a 100% electric heat pump. Crucially, we executed this all at once, not piecemeal.
We knew solar arrays worked. We knew batteries sounded excellent in theory, and the incredible claims of generating three times the energy for every 1 kWh supplied to an air-source heat pump sounded too good to be true. Yet, few had dared to experiment with whether this would function within a house built over 120 years ago. We had no cavity walls, minimal insulation, and merely older double-glazing retrofitted into original hardwood frames. Conventional wisdom pointed to an inevitable investment failure. If one were to simply read the mainstream media, one would run a mile from such a seemingly mad upfront expenditure.
However, as I reviewed hundreds of papers and articles, an outline began to form—a wireframe of something vastly more valuable. The catalyst for this thinking was our experience living with an electric vehicle (EV).
Our EV had proven significantly more reliable, dependable, and comfortable than any traditional internal combustion engine (ICE) vehicle we had leased over the past three decades. But there was one specific variable that made the difference: the flawless, end-to-end integration between hardware and software. This orchestration mitigated the risk of mechanical or operational failure. If an anomaly appeared, an autonomous software update was deployed. These software-driven EVs actually improved with time—an impossibility with traditional ICE cars.
This prior due diligence served as the intellectual foundation for our home. I hypothesised that if three independent hardware systems could be orchestrated by a single software ecosystem to operate as 'ONE', the mathematics would ultimately validate the investment for our 120-year-old house.
My peers called me crazy. They warned that the investment would never yield a return and that the heat pump would leave us freezing in a poorly insulated, century-old house. Their reaction is entirely understandable. In fact, it reflects a principle I see in boardrooms daily: we are actively trained to evaluate operations using 'old rulers'—metrics that practically guarantee we will talk ourselves out of progress.
The Illusion of Fragmented Metrics
If you measure the future with tools designed for the past, my peers were entirely correct. Viewed as disconnected line items under the 'streetlight effect'—the cognitive trap of only seeking value where it is easiest to observe—the returns are abysmal.
Let us be mathematically precise about what this capital allocation truly represents. In corporate finance terms, we are discussing a strict CapEx (Capital Expenditure) deployed from retained earnings. For this use case, when a family contemplates an investment of approximately €30,000, they are deploying net, post-tax income—their highly protected Free Cash Flow (FCF). To accumulate €30,000 in liquid 'dry powder', a household must typically generate closer to €60,000 in top-line gross earnings. The tax authorities claim their share long before a single solar panel is procured, representing a brutal EBITDA-to-FCF conversion drag.
Therefore, a capital deployment decision is never merely about the cash at hand; it must clear a steep hurdle rate, weighed against the sheer, arduous operational effort required to generate that capital in the first place. A family can only allocate the €30,000 net, yet they had to double their top-line output just to secure it. When measured against this unforgiving reality of gross earning effort, the fragmented Return on Invested Capital (ROIC) looked like this:
Battery: 14.2-year payback.
Solar: 13.4-year payback.
Heat pump: 25.4-year payback.
This is exactly how organisations evaluate their operations. They scrutinise siloed business units, fixate upon the friction of the initial CapEx, and conclude that the investment is structurally unviable. They perceive a 'broken O' and fixate upon the Relative, entirely missing the Absolute.
Examining the Interconnected Network
Diagnosticians do not look at isolated parts; we examine interconnected networks. Connecting this hardware transformed our household from a passive consumer into an 'invisible' micro-utility capable of stabilising the energy grid.
This transformation requires a provider (in our case, Zonneplan) that understands the critical interplay between hardware, software and the dynamic wholesale prices in real time to orchestrate 'invisible' value. Finding ‘that’ rare provider is the key. When you view the system holistically, through that new lens, the 'Shadow Data' models a profoundly different, Absolute reality.
After a full twelve months, the verified numbers are in:
We consumed 30.76% more electricity.
We burnt zero gas (this held the biggest risk).
Total utility energy expenditure dropped by >78%.
The True ROI: From Cost Recovery to Compounding Yield
The actual systemic payback for the entire matrix?
Approximately 6.8 years (net)
But the break-even point is merely the first chapter of this financial narrative. Where the 'old rulers' fail most spectacularly is in their inability to measure what happens on day one of year seven.
Once that 6.8-year threshold is crossed, the initial CapEx is entirely recouped. From that moment forward, the matrix transitions from a liability in recovery to an unencumbered asset generating pure, compounding Free Cash Flow.
Consider the operational lifecycle of the underlying hardware. The solar array carries a robust 25-year performance guarantee, and the home battery is warranted for 15 years. The heat pump—often misunderstood by the market as a fragile novelty—is structurally more reliable than a legacy combustible gas boiler. With routine servicing, it runs approximately 33% cheaper to own and maintain over its lifespan, permanently suppressing our baseline operational expenditure (OpEx).
For the subsequent decade—and in the case of the solar array, nearly two decades—this interconnected system will operate as a high-margin annuity, delivering unchecked yield long after the initial capital has been returned. That is the authentic Total Cost of Ownership (TCO) and true ROI calculation that fragmented, silo-based accounting consistently obscures. We did not merely buy hardware; we acquired a long-term cash-generating asset.
And what of the physical reality of living inside this matrix? This compounding financial value held true despite a significantly colder, snowier start to the 2025/2026 winter. As for my peers' warnings that we would be left freezing? Far from it. We actually raised our baseline thermostat by over 10%. As my wife Victoria recently noted, our consignment of extra-thick jumpers and Snoodies™ has officially become obsolete.
The Sovereignty Dividend: Measuring Emotional Freedom
Financial mathematics, however, serves merely as validation. The true value is immeasurable by spreadsheets.
Today, in March 2026, global crises are wreaking havoc upon our energy markets (again). The 'invisible thread' connecting international conflict to every family's energy bill is ruthless and direct. It is precisely this thread I sought to sever four years earlier. Following the discarded breadcrumbs revealed the hidden Absolutes that fixing the Relative in isolation never could.
After our first full year operating this system, we hold the evidence. We have insulated our family castle from the contagion of global instability. Such sovereignty is worth ten times the initial investment. That emotional freedom, for us, is priceless. And just like how an autonomous software update actually improves an EV over time—our 1907 house can only appreciate in systemic efficiency from the homeostatic baseline we have now established. That is the ultimate operational leverage.
The Weight of Absolute Truth
A peer recently remarked to me that being a diagnostician is a fascinating path, but one that requires absolute honesty. He is right. People rarely enjoy having their 'broken O' pointed out, but the pursuit of systemic truth is entirely worth it.
I am sharing this deeply personal financial and operational data for a single reason: transparency. I place absolute accountability squarely at my feet. If my maths is flawed, I inflict a severe capital 'misallocation' upon my own family. That carries the full weight of responsibility.
But absolute truth transforms understanding. The invisible remains so only until measured. Whether I am decoupling my family home or exposing a €4.92 billion gap in Enterprise Value at Vinted, the lesson remains identical.
The 'old rulers' will keep you dependent and vulnerable. The new rulers are on the table. Let’s see who is ready to use them.
The Diagnostician's Blueprint
For executives, operating partners, and value creation teams wanting to de-risk their portfolios and reverse-engineer the exact mechanics of how to begin measuring these 'invisible' new paths, the foundational framework—the Organisational CT Scan—is detailed in my book, Who Moved My Customers?
To buy a copy for your own library choose Amazon or Signed Copy by the Author.
The Declassification of The Vinted €5 Billion Alpha Key™ Report
The most expensive sentence a firm can utter is, "I do not believe it." I am officially declassifying my €330,000 institutional-grade dossier on the Vinted Group. By applying the Organisational CT Scan and the mathematics of the "Integrity Tax", this report reveals the exact structural variances blinding Vinted and its Private Equity backers to €4.92 billion in missed Enterprise Value. Download the blueprint. You tell me: Is my maths wrong?

The most expensive sentence any firm can utter is, ‘I do not believe it.’
For a long time, I did not believe it either.
When I first saw the massive financial leaks hiding in the gap between a boardroom’s promise and the customer's reality, the scale of missing revenue felt too incredible to be true.
Rather than accepting disbelief, I moved beyond the ‘streetlight effect’—the cognitive bias of searching only where it is easiest to look. I stepped past standard metrics and searched the shadows. Holding undeniable proof of unseen friction and lost value in my hands, I spent a decade reverse-engineering those discoveries.
That framework became the Organisational CT Scan.
The CT Scan's sole purpose is to illuminate an asset's ‘Shadow Data’, tracing invisible breadcrumbs to the absolute root-cause contagion. Once isolated, millions of customer ‘gut feelings’ transform into a quantifiable macro-data set to calculate an asset’s Integrity Tax.
In the boardroom, metaphors invite debate; maths invites action. The Integrity Tax is the compounded variance between a system’s designed intent and its operational reality. It is the invisible surcharge paid when data, process, and strategy disconnect, multiplied by the velocity of scale:
This tax monetises the exact structural variance to expose the unpriced Enterprise Value (EV). The maths is asymmetrical, precise, and ruthless.
I am not here to convince anyone; that leap is yours. To remove the friction of disbelief, I am officially declassifying my €330,000 institutional-grade dossier on the Vinted Group. It illuminates the frustrations of their existing user base—their 'why'—and how these ‘gut feelings’ amplify across the hyper-connected Small-World Network.
Inside are the precise execution coordinates and a new B2B revenue engine detailing how Vinted is blinding itself to €4.92 billion in missed Enterprise Value. Vinted is rumoured to be exploring a secondary share sale valuing the company at ~€8 billion. Why not grab the full €10-13 billion?
Building a network of this scale is a monumental achievement. I offer this diagnostic blueprint humbly to Thomas Plantenga, Adam Jay, and the Vinted team, alongside their backers at TPG, EQT Group, Accel, and Lightspeed Venture Partners. Here's to your next historic milestone.
Reverse-engineer my maths. If the numbers spark curiosity on how to bypass generic cost-cutting and uncover trapped top-line revenue in your own firm, coffee is on me in Amsterdam.
If you think, ‘That isn’t happening to us’, the deafening silence of your departing customers would strongly disagree. To see the ‘invisible gorillas’ tearing through your portfolios, you don’t need more data. You need new rulers.
Download the full €5 Billion Vinted Group audit document as a PDF below. You tell me: Is my maths wrong?
Author’s note: I declassified this €5B report for a single reason: transparency. It places absolute accountability squarely at my feet. I cannot hide behind this dossier's findings. If the maths is wrong, I am wrong, and I will take full public responsibility.
To the executives, operating partners, value creation teams, and performance improvement advisory firms underwriting the next wave of European growth capital: physical copies of this diagnostic blueprint are currently sitting on the desks of two leading PE Performance Improvement firms.
The baseline for uncovering true Enterprise Value has shifted. Value now compounds—or collapses—at the exact speed of the inescapable Small-World Network contagion. You cannot cost-cut or strategise your way out of a structural contagion; the customer’s reality always wins.
For those wanting to reverse-engineer the exact mechanics of the Integrity Tax and the Organisational CT Scan, the foundational framework is detailed in my book, Who Moved My Customers? (available on Amazon, or as signed copies via my website).
The new rulers are on the table. Let’s see who is ready to use them.
The €1.375 Billion Validation: How a PDF jumped the “Small-World Network” to change Hugo Boss
On January 8, 2026, HUGO BOSS validated a €1.375 billion diagnosis. This is the forensic timeline of how a single Diagnostic Alpha report traversed the "Small-World Network" to bypass the boardroom's immune system, overcome the "I Don’t Believe It" filter, and transform a womenswear blind spot into corporate strategy.

Date: January 2026
Case: HUGO BOSS AG
Asset Class: Diagnostic Alpha
The Most Expensive Sentence in Business
There is a parable I often share about a policeman finding a man searching for his keys under a streetlight. When asked if he lost them there, the man says, “No, I lost them in the park, but this is where the light is.”
This is the Streetlight Effect. In the corporate world, there is a gravitational pull to focus only on visible, comfortable metrics—Gross Margin, Sell-Through, Wholesale Volume—while ignoring the massive value leaks hidden in the operational shadows.
For the last decade, I have observed a recurring pattern. When I present a CEO with forensic evidence of a billion-euro opportunity hiding in those shadows, the initial reaction is rarely joy. It is denial.
“I don’t believe it.”
That sentence is the most expensive liability on any balance sheet. It is the sound of Organisational Homeostasis—the immune system of a company fighting to keep things the same, even when “the same” is slowly eroding its foundation.
But occasionally, the logic of the shadow becomes too powerful to ignore.
The €1.375 Billion Mirror
On September 1, 2025, I published a forensic diagnostic titled The €1.375 Billion Irony and shared it publicly.
The report wasn’t a critique of fashion; it was an audit of value. It diagnosed HUGO BOSS with a structural blindness: the company was treating its womenswear division as a “stylish afterthought”. The data was unequivocal—the division had collapsed from a peak of over 13% of group revenue to a four-year average of just 6.8%.
My prescription was surgical: To capture the €1.375 billion in annual revenue that was missing, the company needed to stop treating womenswear as an adjunct to the men’s business. It required a “surgical separation”—a standalone business unit with the autonomy and expertise to see the female customer who had been waiting in the dark.
Four months later, the diagnosis became strategy.
In January 2026, HUGO BOSS announced a radical restructuring: the creation of an independent Womenswear Business Unit and the appointment of Kerstin Dorst to lead it.
The alignment between the Diagnostic Alpha prescription and the corporate execution is a near-perfect mirror:
The Diagnosis (Sept 2025): I argued the brand failed to “see” the female customer, citing Dr. Kerstin Brehm’s feeling of being invisible.
The Execution (Jan 2026): The company appointed a specialist leader explicitly to “address gender-specific preferences even better.”
The Irony: In a poetic twist of validation, the company hired a Kerstin (Dorst) to answer the question posed by a Kerstin (Brehm).
The Physics of the Pivot
How does a PDF report from an external consultant migrate to the boardroom agenda of a DAX-listed giant in four months?
It is the physics of the Small-World Network.
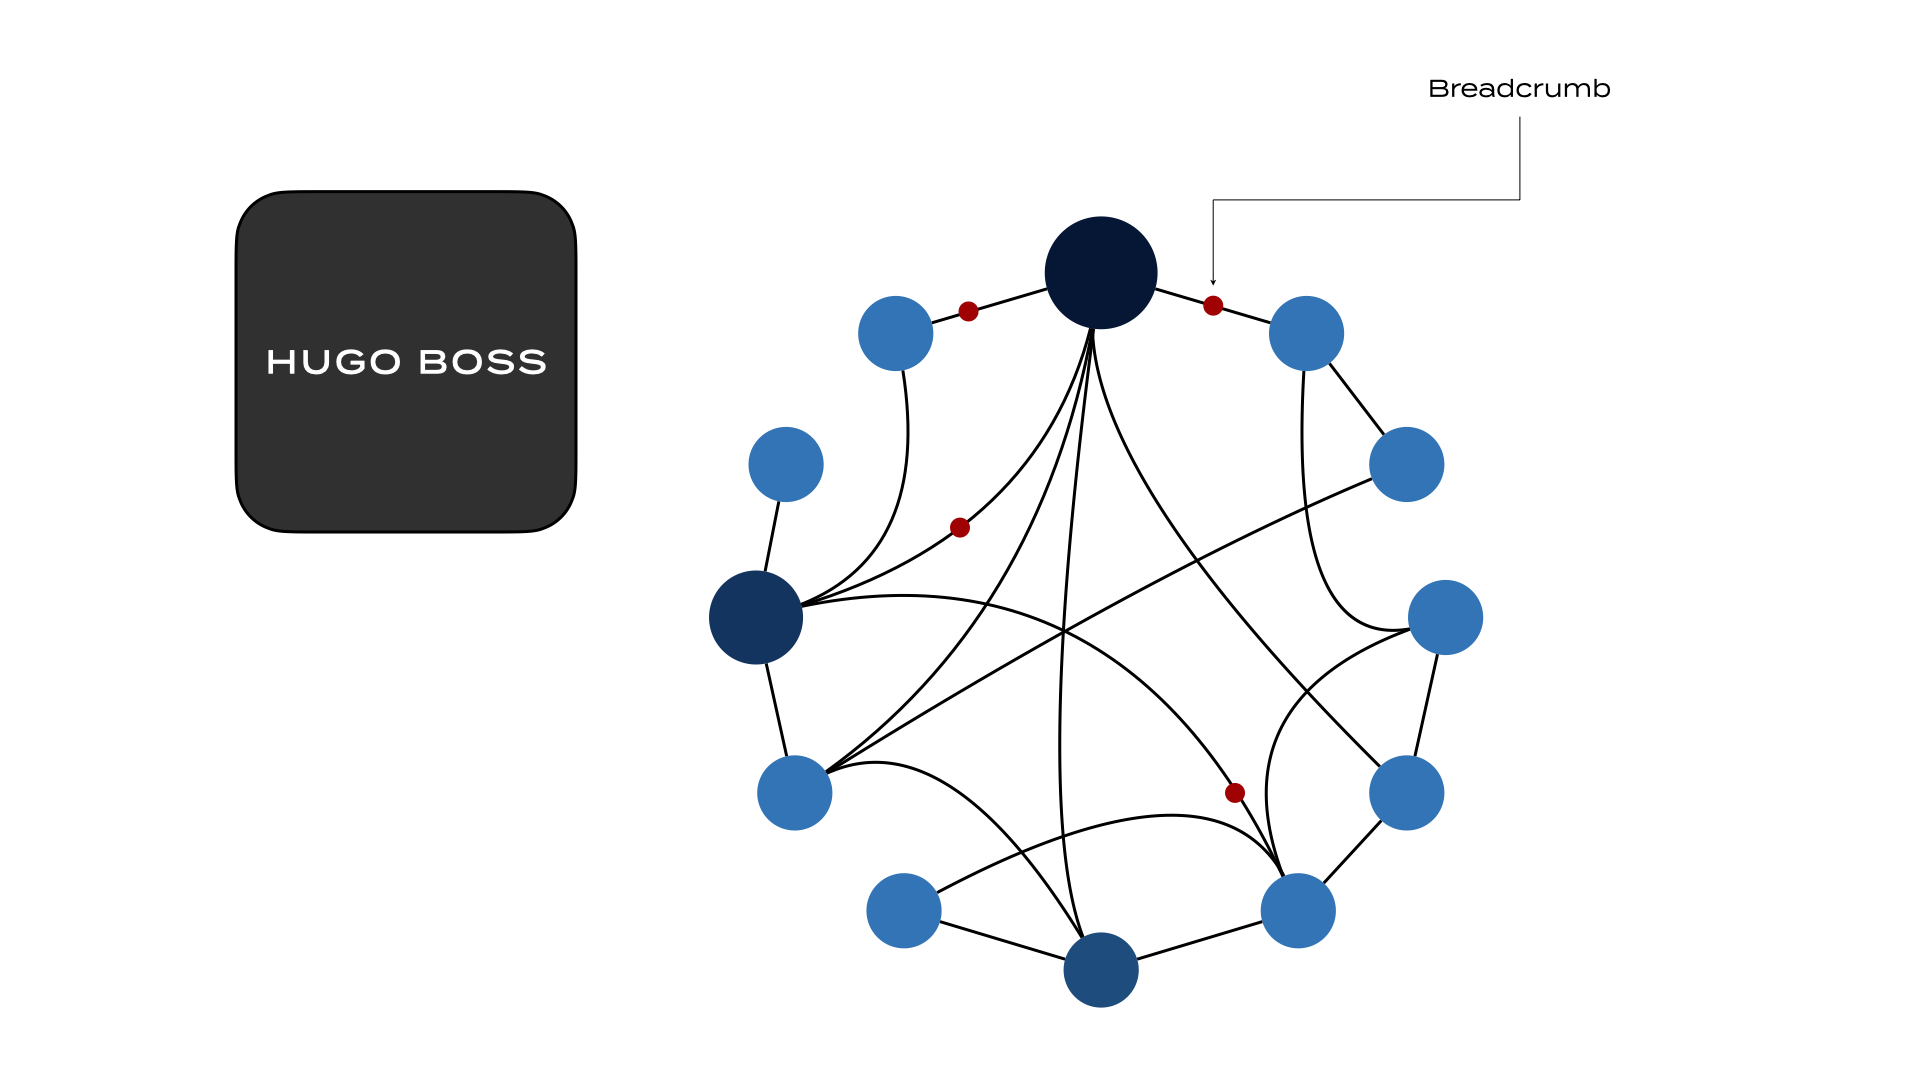
Our forensic analysis of the report’s digital footprint revealed that the “injection” occurred immediately. Within weeks of publication, nearly 2% of the report’s readership consisted of Hugo Boss insiders—specifically, directors and VPs.
The idea didn’t need to go viral globally; it just needed to infect the decision-making nucleus. Through private channels—the “Dark Social” network of saves and forwards—the diagnostic bypassed the “I don’t believe it” filter and landed on the strategy deck.
The Lesson: New Rulers for Old Problems
The HUGO BOSS case is not unique. It is simply the most visible validation of a universal truth:
“To see the invisible, we simply need new rulers.”−Morten J. Sørensen
The “Old Rulers” (traditional KPIs) told HUGO BOSS that womenswear was a difficult market. The “New Rulers” (Diagnostic Alpha) revealed it was a billion-euro opportunity disguised as a problem.
The company has now turned its streetlight toward that billion-euro opportunity. They have moved from “I don’t believe it” to “Let’s build it.”
For the rest of the market, the question remains:
What billion-euro “Invisible Gorilla” is walking through your business and investment right now, waiting for someone brave enough to turn on the lights?
READY TO TURN ON THE LIGHTS?
If your organisation is ready to move beyond “Organisational Homeostasis” and identify its own billion-value blind spot, initiate an Alpha Key™ Forensic Audit.
We apply the same methodology used to diagnose HUGO BOSS, PRADA, VINTED, TIMBERLAND, and PAUL SMITH.
INITIATE DIAGNOSTIC BRIEFING.
Lazy Leverage and a Covenant Breach: An Anatomy of PE's Playbook Failure
The Valentino covenant breach is not a market failure; it's a critical, preventable corporate heart attack caused by lazy leverage and a failure of the PE playbook. Discover how the Organisational CT Scan reveals the systemic operational flaws behind the debt breach and uncovers over €3.7 billion in hidden Enterprise Value.

Last week, I wrote about PE's 'Illusion of Health'. And asked if the industry's standard methodology has reached its limits. Unfortunately, this week, Valentino verified my point.
News broke in Bloomberg with the article “Valentino in Talks With Banks as Luxury Drop Prompts Debt Breach” that the Kering and PE-owned Mayhoola for Investments' brand has breached its debt covenants.
This isn't just an industry downturn; it's a very preventable corporate heart attack. The symptoms started years earlier. Lazy leverage has created unhealthy companies, and the patients are now being rushed into the ER on stretchers at an increasing pace.
Has the industry's standard methodology reached its limits? You decide.
The official narrative may blame the markets, but that's taking a painkiller for a deeper, undiagnosed disease. The real cause? A systemic operational failure. My Organisational CT Scan reveals a catastrophic, decentralised "back-stage" reality where the absolute basics of a luxury transaction are failing.
The unintended consequences?
A broken returns process, often described as a "scam".
Unresponsive, rude, and incompetent support.
Quality defects inconsistent with luxury pricing.
Extreme delays forcing customer chargebacks.
Lost items, wrong orders, and delivery chaos.
The Operational Causation
These interconnected operational erosions are what have created the dangerous financial symptoms at Valentino today. Using new rulers, a diagnostic would have revealed a different path to:
Reduce the debt-to-EBITDA ratio from a problematic 4.35x down to a healthy 2.48x, placing Valentino well within any conventional covenant limit.
Make the full buyout by Kering more urgent, rather than delaying it until 2028/2029.
Add over €3.7 billion in Enterprise Value in the process.
Let's be clear: this isn't just an asset failure; it's a failure of the PE playbook. You can't financially engineer your way out of the causal inefficiencies you can't see, touch or measure '"customer emotions". Valentino is simply the latest public example.
If an 'outsider' like me can find an asset's root causes and specific actions to avert a default, why can't asset owners (PEs and GPs)? You have incredible access to the world's best tools, models, and resources. Professor Ludovic Phalippou at Saïd Business School, University of Oxford, might have some tools and views on this ;-)
Diagnostic Alpha is a data-driven exposé of the gap where the perception of value has become detached from the reality of creating it. The "Precision Playbook" in the first comment below is for those leaders who know the greatest value is found not in the light, but in the shadows.
P.S. To the current Valentino owners: Your official strategy focuses on the "front-stage". The real unseen crisis is in your "back-stage" execution. My findings from 2017 are still on the table.
The full story and the methodology used to see this crisis coming are in my guide: "A PRECISION PLAYBOOK FOR AN AGE OF DIAGNOSTIC ALPHA." It outlines the five steps that move you beyond the streetlight and find verifiable value. Download your free copy.
A Precision Playbook for an Age of Diagnostic Alpha
Private Equity faces a crisis of methodology where financial engineering masks a dangerous "Illusion of Health". This precision playbook offers a surgical upgrade, using a diagnostic approach to move beyond the "Streetlight Effect" and unlock verifiable alpha.

A Surgical Upgrade for PRIVATE EQUITY Unlocking Verifiable Alpha Beyond the Streetlight Effect
A Note on Perspective
This playbook, like my book, was born from a personal journey driven by a single question: Why? For years, I received expert advice that produced results lacking verifiable answers, which led me to step beyond the comfort of the conventional Streetlight Effect and search for a truth grounded in evidence, not opinion.
I was told my path was dangerous by the same experts, reckless even. I chose to trust my own curiosity and evidence trail. For ten years, I questioned conventional wisdom, seeking a diagnostic truth. The answer came from a Coronary Artery Calcium (CAC) scan—a non-invasive CT scan designed to assess risk long before symptoms appear. The scan produced a score of 2.5%, a verifiable truth that provides a near-guarantee against a heart attack for the next decade, proving that the consensus is not always the truth. This was a result I could build upon.
This was my Rubicon. It taught me that the most valuable breakthroughs are found not by reinforcing consensus, but by having the courage to dare to look beyond the edges of the Streetlight Effect. Like the innovators and rebels celebrated for thinking differently, the greatest opportunities lie waiting just outside the established field of view, in the shadows of the unquestioned. It is a lesson in the profound power of an independent, critical-thinking perspective.
This playbook is for those leaders. It is for the innovators, investors, and visionaries across the Private Equity ecosystem who understand that true alpha is generated by seeing what others miss. It is a tool for those who are ready to embrace their own curiosity, to dare to look where others don't, and to find the profound unseen value that awaits them beyond the streetlight.
For years, I applied this diagnostic to brands worldwide. My path converged with Private Equity after a series of insights—from Professor Ludovic Phalippou's analysis in Private Equity Laid Bare to a rising chorus of insider critiques—all revealed a common theme: the industry is grappling with the very crisis of methodology I had been treating at the brand level all along—a crisis where its very perception of value has become detached from the reality of creating it.
This playbook is my answer.
Morten J. Sørensen
Managing Director and Author of Who Moved My Customers?
01 | The Executive Summary
A Crisis of Methodology
The principles of foundational diagnostics teach that any complex system—whether biological or corporate—can appear healthy while masking a deep, internal decay. Private Equity is now facing its own version of this challenge, where a reliance on malleable metrics and financial engineering has created a dangerous "Illusion of Health”.
This has fuelled a significant reputational challenge, resulting in a playbook that has reached the limits of its effectiveness. A perception of opacity now creates a gap between a firm's perceived success and the trust it commands from investors. The toolkit they have operated with, while once profitable, now creates predictable challenges:
The Debt Dilemma: The leveraged buyout (LBO) model saddles assets with debt, increasing bankruptcy risk by an estimated 18% and prioritising financial engineering over foundational strength.
The Perception of Extraction: Practices like dividend recapitalisations are often perceived as 'value extraction schemes’, impacting the 'gut feeling' of Limited Partners.
The Transparency Gap: The reliance on malleable metrics like IRR makes it impossible to differentiate genuine, skill-based alpha from simple market luck, leading to a crisis of credibility.
These are not separate issues. They are symptoms of a single, core challenge: searching for value only where the light of conventional metrics shines brightest. This reality has left the industry at a crossroads.
In this new era where diagnostic alpha is the only thing that matters, this playbook is the tool that unlocks the prize of verifiable alpha. It offers a return to the first principles of value creation, designed to solve Private Equity's own demarcation problem: to draw a clear line between skill and luck, unlocking the profound value hidden in the shadows.
02 | The Paradigm Shift
Introducing the Organisational CT Scan
The challenges outlined in the Executive Summary are not the result of a failed model, but of a flawed perspective. For too long, the industry has operated under the cognitive bias known as the “Streetlight Effect”—searching for value only where financial data is easy to see, while the real, untapped potential remains hidden in the shadows.
This approach treats every company as an “Opaque Black Box”, leaving firms to make high-stakes decisions based on an incomplete picture. This perspective comes not from within an industry that can be hesitant to question itself, but from an independent, diagnostic viewpoint focused solely on one metric: documented, quantified value creation that benefits the asset directly.
To generate true, sustainable alpha requires a fundamental paradigm shift: moving from superficial observation to deep diagnosis. This new approach is built on a single, guiding principle:
“VIRTUALLY ANYTHING THAT HAS AN EFFECT CAN BE OBSERVED, AND ITS IMPACT UNDERSTOOD, EVEN IF NOT WITH OLD RULERS.”
To act on this principle, a new kind of ruler is required. The Organisational CT Scan is a proprietary diagnostic methodology designed to illuminate an asset’s Opaque Black Box. It provides a non-invasive, evidence-based way to see inside virtually any asset, measure its true operational health, and quantify the financial impact of its customer disconnects.
This diagnostic approach forms the foundation of a new, high-precision playbook designed for the modern economy. This is not a single snapshot, but a multi-layered diagnostic capable of revealing different truths—from customer base synergies in an M&A scenario to hidden operational frictions within a single asset—depending on the challenge at hand.
03 | The 5-Step Precision Playbook
The following five steps provide a clear, actionable roadmap for PE firms to navigate today's challenges. This playbook moves beyond generic financial engineering to a surgical approach focused on diagnosing issues, unlocking hidden value, and proving verifiable alpha.
Step 1: De-Risk the Debt-Fuelled Acquisition
The Challenge
The leveraged buyout (LBO) model, a cornerstone of the PE industry, is creaking under its own weight. In a typical buyout, loans are put in the name of the purchased company, saddling the asset with hefty debt from day one. This practice contributes to a significantly higher bankruptcy risk, with studies indicating it is 18% higher after a leveraged buyout. Conventional due diligence, which focuses on visible financial data, often overlooks the hidden operational dysfunctions that could jeopardise the investment.
The Upgrade: Deploy the Organisational CT Scan Before You Sign
Instead of buying a problem, you acquire a solution. A pre-acquisition scan provides a deep, proprietary diagnostic of an asset's true operational health and integrity. This allows you to:
De-Risk the Debt: The scan meticulously exposes hidden risks and quantifies previously unseen inefficiencies before you commit capital. This ensures your debt load is based on a robust valuation of the asset's true potential, not just its visible shell.
Build an Evidence-Based Roadmap: Armed with a verifiable understanding of the asset's health, you transform operational risk into a de-risked, actionable plan for value creation from day one.
Step 2: Uncover Value BEYOND THE SATURATED MARKET
THE PERCEIVED CHALLENGE
The days of finding undervalued companies with obvious "fat to trim" are largely over. Intense competition has led to a situation where there are record amounts of uninvested cash ("dry powder") because it's getting "harder and harder to find those companies" with clear potential for improvement. Many sectors have already received the "PE treatment", leaving traditional playbooks with few levers to pull beyond further financial engineering.
THE HIDDEN OPPORTUNITY
The challenge isn't a lack of opportunity, but a lack of precision tools to see it in a competitive market. A firm that can look beyond the streetlight doesn't just compete—it dominates. This is how you gain the upper hand:
Find Obscured Value: The Organisational CT Scan is designed to uncover the profound potential that traditional due diligence is blind to. My case files prove that over €30 billion in untapped revenue can be hidden in plain sight—concealed by a single linguistic word on a product label or an efficient internal keystroke.
Transform Your Deal Flow: Instead of fighting over the same obvious assets, you gain the ability to see a landscape rich with undervalued opportunities. This transforms your role from a market participant subject to intense competition to a precision architect of value with a distinct, reputational, and sustainable advantage.
Step 3: SHIFT FROM VALUE EXTRACTION TO SUSTAINABLE VALUE CREATION
The Challenge
High fees are often generated not just from successful exits, but from practices that, while designed to generate returns, can be perceived as 'value extraction schemes' that risk a company's long-term health. The consequences of a purely financial focus can be severe, particularly in sensitive sectors like healthcare, where studies have noted negative patient outcomes in some PE-owned facilities.
The Upgrade
Move from emergency surgery to a preventative stent that builds organisational health. A broad-stroke financial approach can be like waiting for a patient to show acute symptoms before intervening with high-risk surgery. A modern, high-precision playbook focuses on diagnosing issues and restoring Organisational Health before a crisis. This approach is more efficient and effective, as it targets specific needs. It is achieved by:
Diagnosing Before You Cut: The Organisational CT Scan acts as a cardiac CT scan, non-invasively finding the specific "plaque"—the customer disconnects and hidden inefficiencies—that are silently clogging the arteries of the business.
Applying Surgical Precision: By pinpointing the precise nature and location of the problem, you can apply a targeted "stent"—a minimally invasive operational fix that restores healthy value flow. This approach builds a stronger, more resilient company by protecting its culture of innovation and strengthening customer loyalty—the very assets that drive long-term enterprise value.
Step 4: Shatter the "Illusion of Health" with Verifiable Metrics
The Challenge
The Private Equity industry's reputation for opacity is well-earned. For decades, firms have used performance charts that experts now suggest can be "phoney" and based on "highly convenient benchmarks". The key metric, the Internal Rate of Return (IRR), is susceptible to manipulation, which can create a reassuring but misleading Illusion of Health while the value of unsold assets is overly optimistic. This lack of transparency makes it impossible to differentiate genuine skill from simple market luck.
THE UPGRADE: WEAPONISE YOUR TRANSPARENCY
Instead of hiding behind opaque, easily manipulated numbers, a high-precision playbook leads with verifiable proof of genuine value creation. This is achieved through two proprietary metrics derived directly from the Organisational CT Scan:
Quantify the Unseen: The Asset Efficiency Score (AES) is a proprietary metric that provides a true measure of an asset's operational health. It moves beyond sentiment and opinion to quantify unrealised potential in concrete monetary terms, representing the value being lost due to internal frictions and causal customer disconnects. It provides a verifiable, data-driven baseline for performance that cannot be easily manipulated.
Certify Your Success: The Asset Efficiency Certification (AEC) is the ultimate proof of performance. It provides transparent, third-party validation that tracks an asset's AES improvement over the investment lifecycle (3-7 years). By documenting long-term, quantified improvements in operational effectiveness, the AEC empowers General Partners to demonstrate genuine, skill-based alpha over simple market luck irrefutably to their Limited Partners (LPs) and other stakeholders.
Step 5: Engineer a Credible Exit Strategy
The Challenge
The traditional exit often relies on pure market mechanics. A common goal is to take a company public via an IPO and secure its inclusion in a major index like the S&P 500. This is a powerful strategy because it can create a pool of "forced buyers" (like index funds and pension funds) who must purchase the stock, which can boost a valuation based on market mechanics, sometimes independent of the company's underlying operational health. This dynamic can reinforce a narrative that PE prioritises financial engineering over building fundamentally sound companies.
THE UPGRADE: BUILD A LEGACY OF INDISPUTABLE VALUE
A high-precision playbook doesn't just rely on market timing; it engineers a narrative of genuine strength that builds long-term credibility and maximises value based on verifiable proof. This is accomplished by:
Exiting with Proof: Instead of just bringing a good story to the market, you bring a certified, healthy asset. The Asset Efficiency Certification (AEC) provides profound, verifiable assurance to future buyers, LPs, and the public market that they are acquiring a resilient, high-performing company with a proven track record of operational excellence.
Controlling the Narrative: Armed with a certified asset and data-backed success stories, your conversation with the market is no longer defensive. It's a proactive demonstration of excellence that allows you to build a powerful reputation as a credible architect of genuine market growth, transforming your firm's image from a financier to a proven builder of resilient companies.
04 | The Diagnostic Alpha Framework
A 3-Phase Framework
While the 5-Step Playbook outlines when and why to apply a diagnostic mindset across the investment lifecycle, this chapter details the operational engine that powers the entire process. This 3-phase framework is the systematic methodology for moving any asset from an "Opaque Black Box" to a source of verifiable, skill-based alpha. It is the engine that drives the shift from superficial observation to deep diagnosis, unlocking profound value hidden beyond the Streetlight Effect.
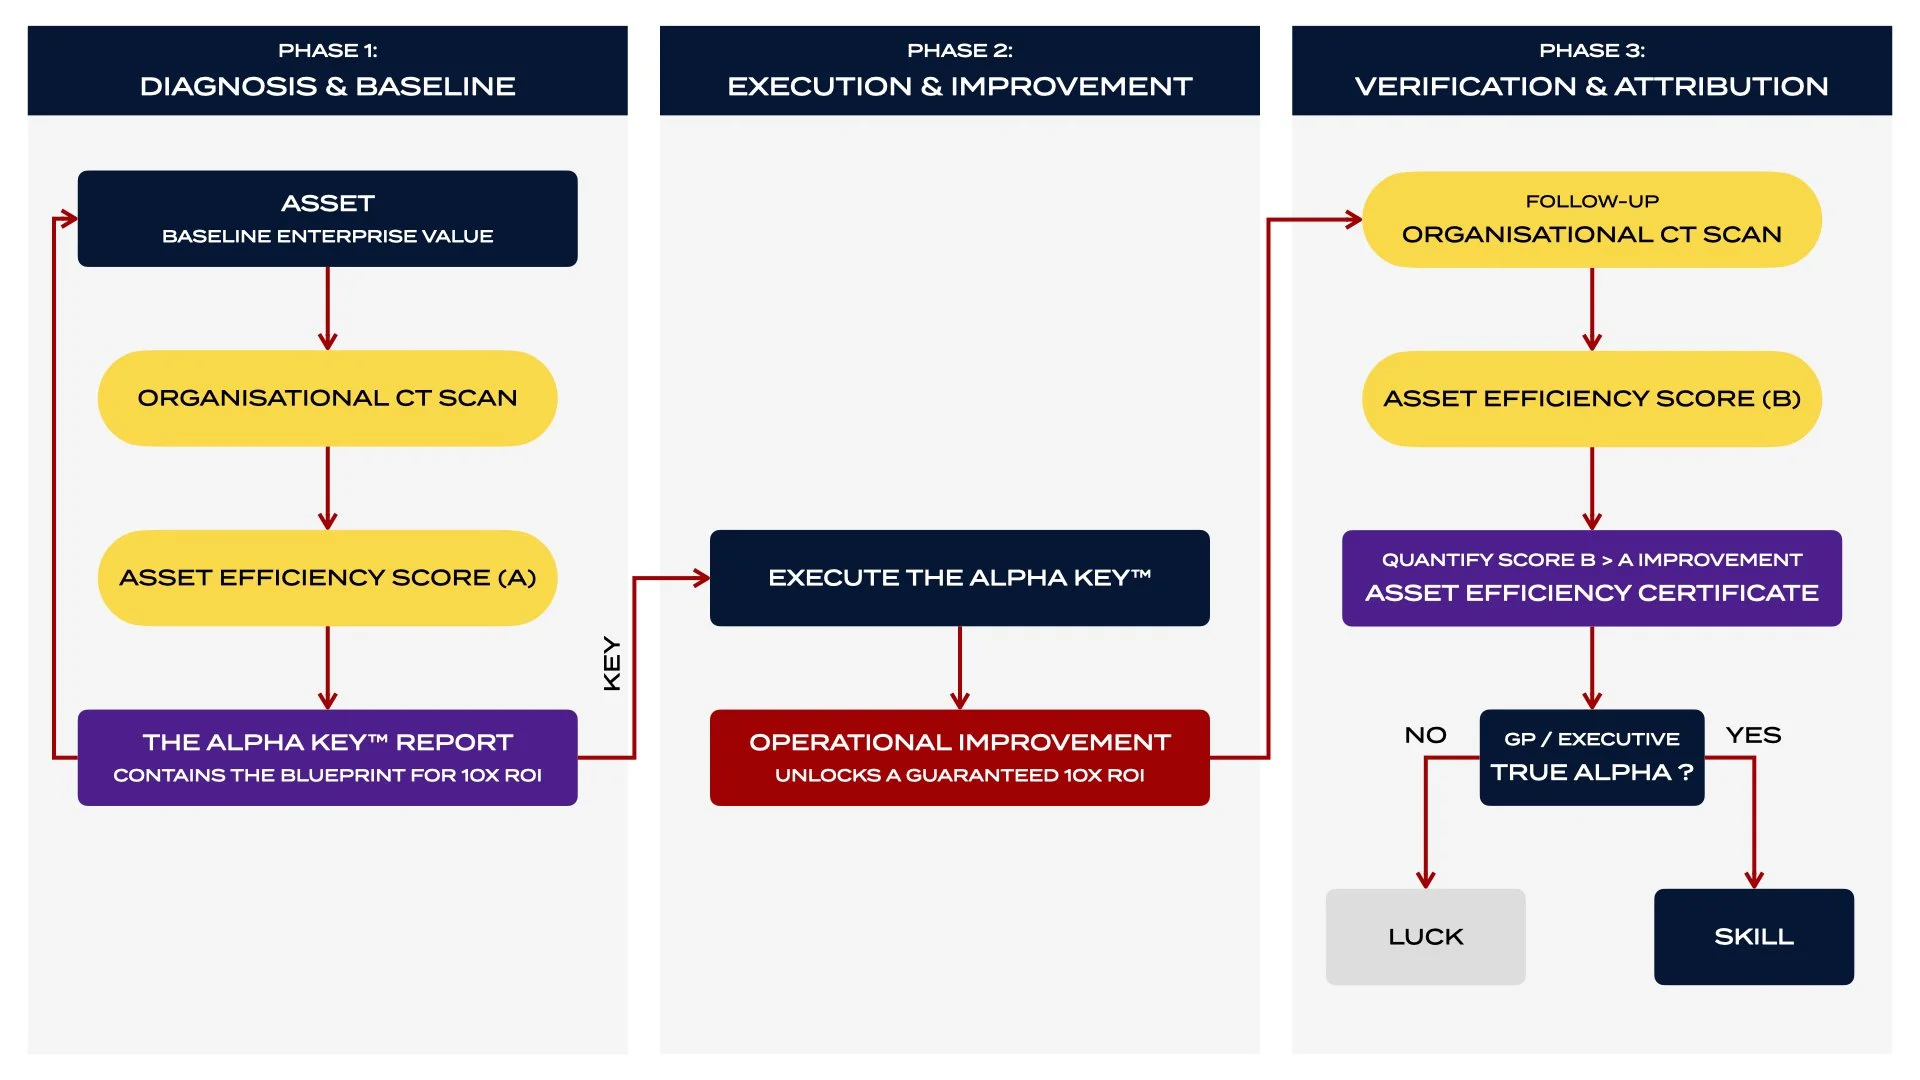
Phase 1: Diagnosis & Baseline
The first phase is a non-invasive, evidence-based process designed to establish a verifiable truth about an asset's current operational health.
Organisational CT Scan: This proprietary diagnostic moves beyond surface-level metrics to see inside an asset's true operational state. It synthesises a wide array of inputs—from financial data and internal processes to qualitative customer sentiment—to illuminate the hidden frictions and disconnects that erode value.
Asset Efficiency Score (AES): From the scan, we derive the Asset Efficiency Score (AES), a proprietary metric that quantifies the value being lost due to these disconnects. It provides a single, data-driven baseline (Score A) of the asset's health. A lower score signifies a larger, untapped opportunity for improvement.
The Alpha Key™ Report: The findings are delivered in this report, which contains the blueprint for achieving a minimum 10X ROI. It provides a single, high-impact, and evidence-based Alpha Key™ that targets the root cause of the asset's inefficiency.
Phase 2: Execution & Improvement
This phase is about surgical action. It translates the diagnostic insight from Phase 1 into a targeted, high-impact operational intervention.
Execute the Alpha Key™: This step involves the precise implementation of the single, transformative insight delivered in the report. It is the catalyst for moving the asset from its organisational homeostasis baseline toward a state of optimal performance.
Operational Improvement: The result is a targeted operational improvement that directly addresses the identified customer disconnect. This is the phase where the guaranteed 10X ROI is unlocked, transforming the diagnostic blueprint into realised, tangible value.
Phase 3: Verification & Attribution
The final phase provides irrefutable proof that the intervention was successful and that the value created was the result of skill, not luck.
Follow-up Scan & Score (B): A second Organisational CT Scan is conducted post-implementation to produce a new, updated Asset Efficiency Score (B).
Quantify Improvement (B > A): Verifiable improvement is demonstrated when the new score (B) is greater than the baseline score (A). This quantified, positive change is memorialised in the Asset Efficiency Certificate, providing transparent, third-party validation of the improvement.
GP / Executive True Alpha: By documenting a direct, causal link between the targeted intervention (Phase 2) and the data-driven improvement in operational effectiveness (Phase 3), the framework provides definitive proof of performance. It empowers General Partners and Executives to irrefutably demonstrate genuine, skill-based alpha over simple market luck to LPs and all other stakeholders.
05 | A Case Study in Precision
The principles in this playbook are not theoretical. The following case study demonstrates one powerful application of this diagnostic process, designed to uncover profound, quantifiable value where others see nothing.
Unlocking €1.375 Billion in the Shadows
HUGO BOSS
1. Following the Scent Beyond the Streetlight
My investigation did not begin with a financial statement, but with a human signal—a faint scent of customer disconnect that traditional analysis always misses. Dr. Kerstin Brehm, a former cardiac surgeon and the brand's ideal customer, posted publicly about her lifelong loyalty, yet current feeling of being a "stylish afterthought." Her question was profound and one I wanted to answer:
“Why was a brand she loved making her feel invisible?”
This is the starting point for the Strategic Bloodhound: a signal from the shadows that demands investigation.
2. The Visual Diagnosis of the Problem
The first step was to determine if Dr. Brehm's “feeling” was an emotion or a quantifiable reality. The Organisational CT Scan began by analysing two decades of HUGO BOSS's own financial data. The result was unequivocal.
The chart below visualises the problem. After peaking at over 13% of group revenue, the Womenswear division collapsed, falling to an average of just 6.8% over the last four years. This gap between the 20-year historical average and current performance represents €137 million in missed annual revenue. I call this The Cost of Decay—the annual price a company pays for simply failing to maintain its own established baseline. While this data provided the verifiable truth of what was happening, it could not answer the most important question: Why?
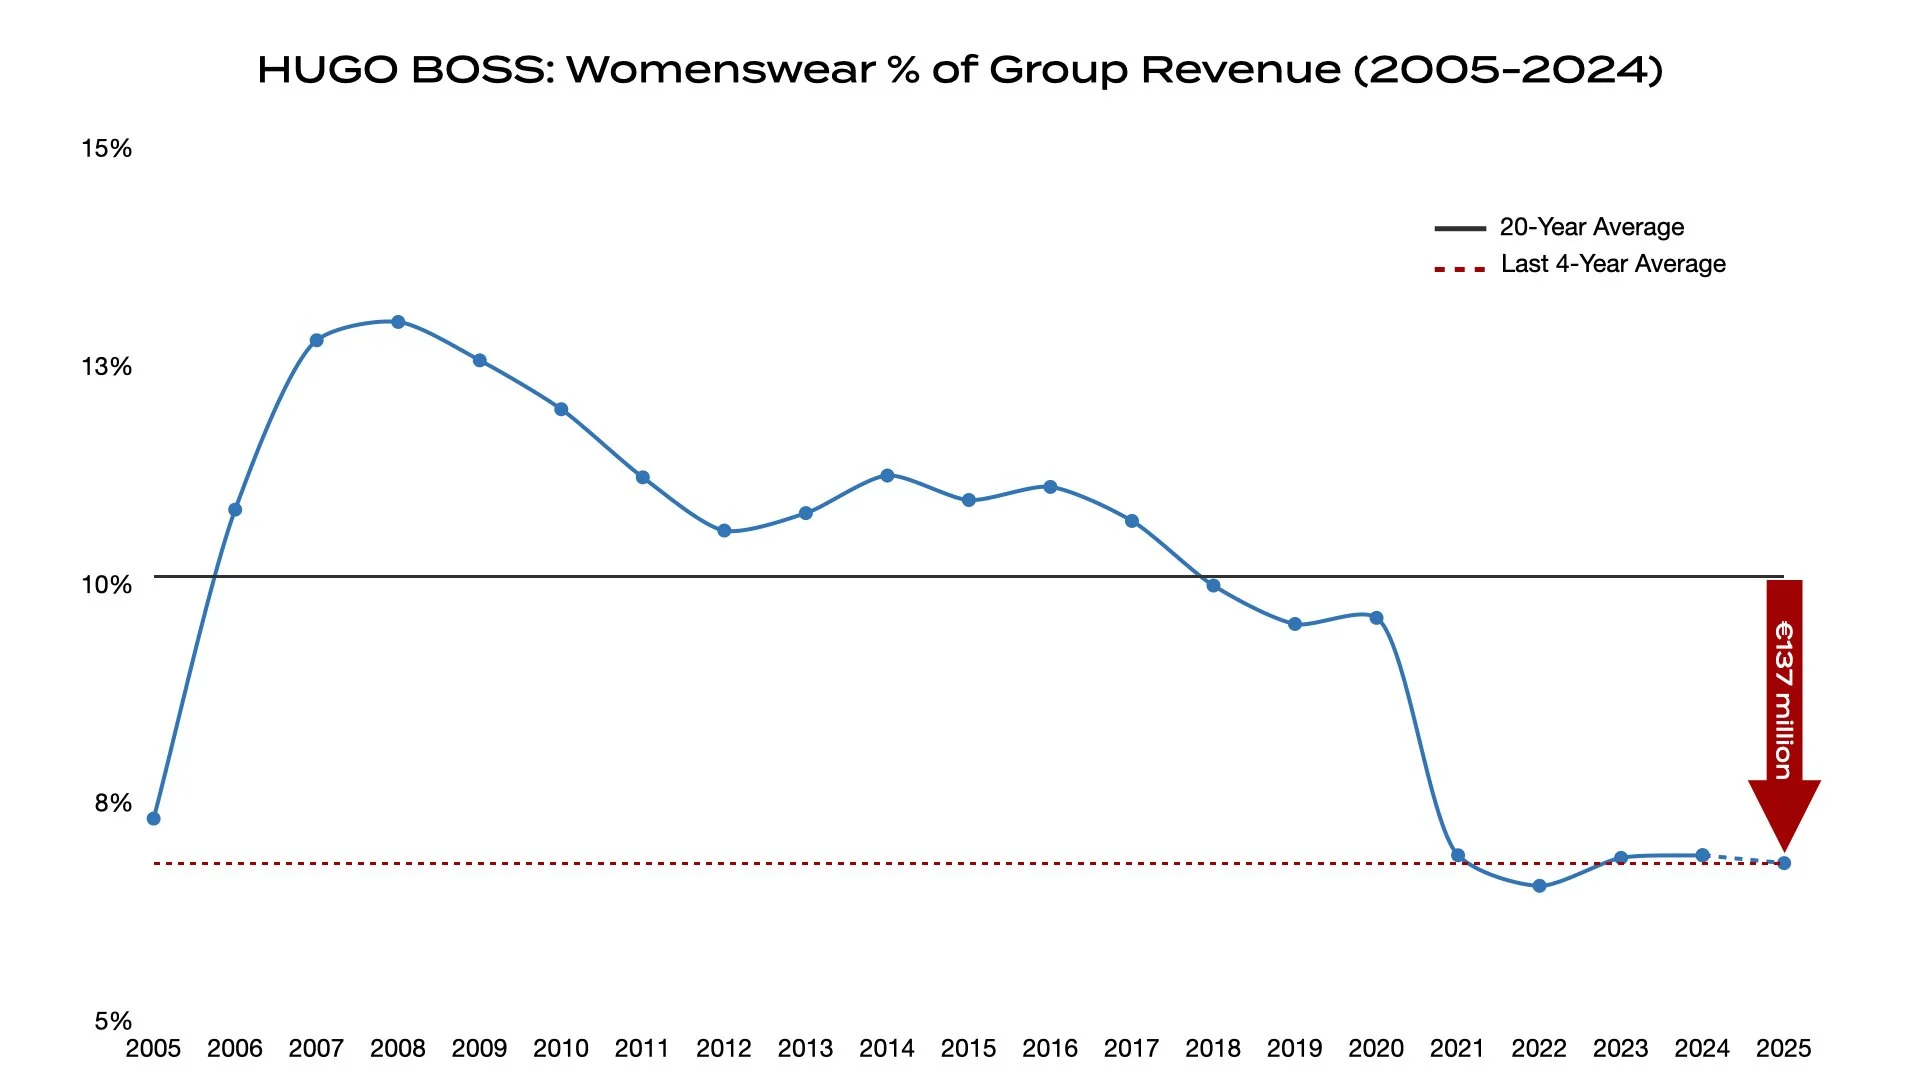
Diagnosis vs. Disbelief: Quantifying the Prize for Vision
While the problem was clear, HUGO BOSS was operating under its own Streetlight Effect. The company's focus was on the bright light of its 'CLAIM 5' strategy, which had driven record top-line revenue. However, sophisticated investors were sceptical, noting a depressed share price that contradicted the celebratory narrative.
They sensed what my Organisational CT Scan would prove: the Illusion of Health was masking a massive, unaddressed vulnerability.
3. Unlocking the Opaque Black Box
The diagnostician in me revealed the disease: a systemic failure to see, value, and serve its female customers. This was the same verifiable truth I had presented to the company myself in reports from 2017, 2019, and 2021. My follow-up conversations with Dr. Brehm confirmed that HUGO BOSS leadership had been presented with these conclusions from multiple sources. The response was consistently a variation of "I don't believe it"—a classic symptom of a leadership team insulated from reality by their own success.
The core disconnects weren't about hemlines or handbags; they were about a fundamental lack of visibility and invitation. As two customers outside the Stuttgart store told me, "How can we buy what we cannot see?”
4. The Verifiable Alpha Opportunity
The true power of this playbook is not just in diagnosing problems, but in quantifying the prize for solving them. A 2025 re-analysis confirmed that a 60/40 gender revenue split is a realistic potential for HUGO BOSS. Closing this gap would add over €1,375 billion in annual top-line revenue.

This is The Prize for Vision—the verifiable alpha waiting in the shadows. But for a Private Equity owner, the ultimate prize is how this top-line opportunity translates into the language of their world: EBITDA margin.
5. THE EBITDA PAYOFF: THE PRIVATE EQUITY PERSPECTIVE
For a PE owner, the true prize isn't just top-line revenue; it's the explosive impact on the bottom line. In 2024, HUGO BOSS delivered an EBITDA margin of 18.8%.
A hypothetical analysis shows that by capturing the €1.375 billion opportunity in womenswear, that margin would have catapulted to a world-class 27.3%. That nearly 900-basis-point improvement—a 1.5x multiple on the asset's core profitability—is the definitive proof of value creation: the high-octane fuel required to comfortably service LBO debt and dramatically increase enterprise value at exit.
This case study is the high-precision playbook in action. It demonstrates how starting with a faint human signal leads to a deep diagnosis that unlocks a multi-billion-euro opportunity—one that was always there, waiting patiently to be seen. The key to unlocking this value is now in their hands, but as this investigation proves, you cannot give billions in revenue to a leadership team that refuses to believe it exists just beyond their own Streetlight Effect.
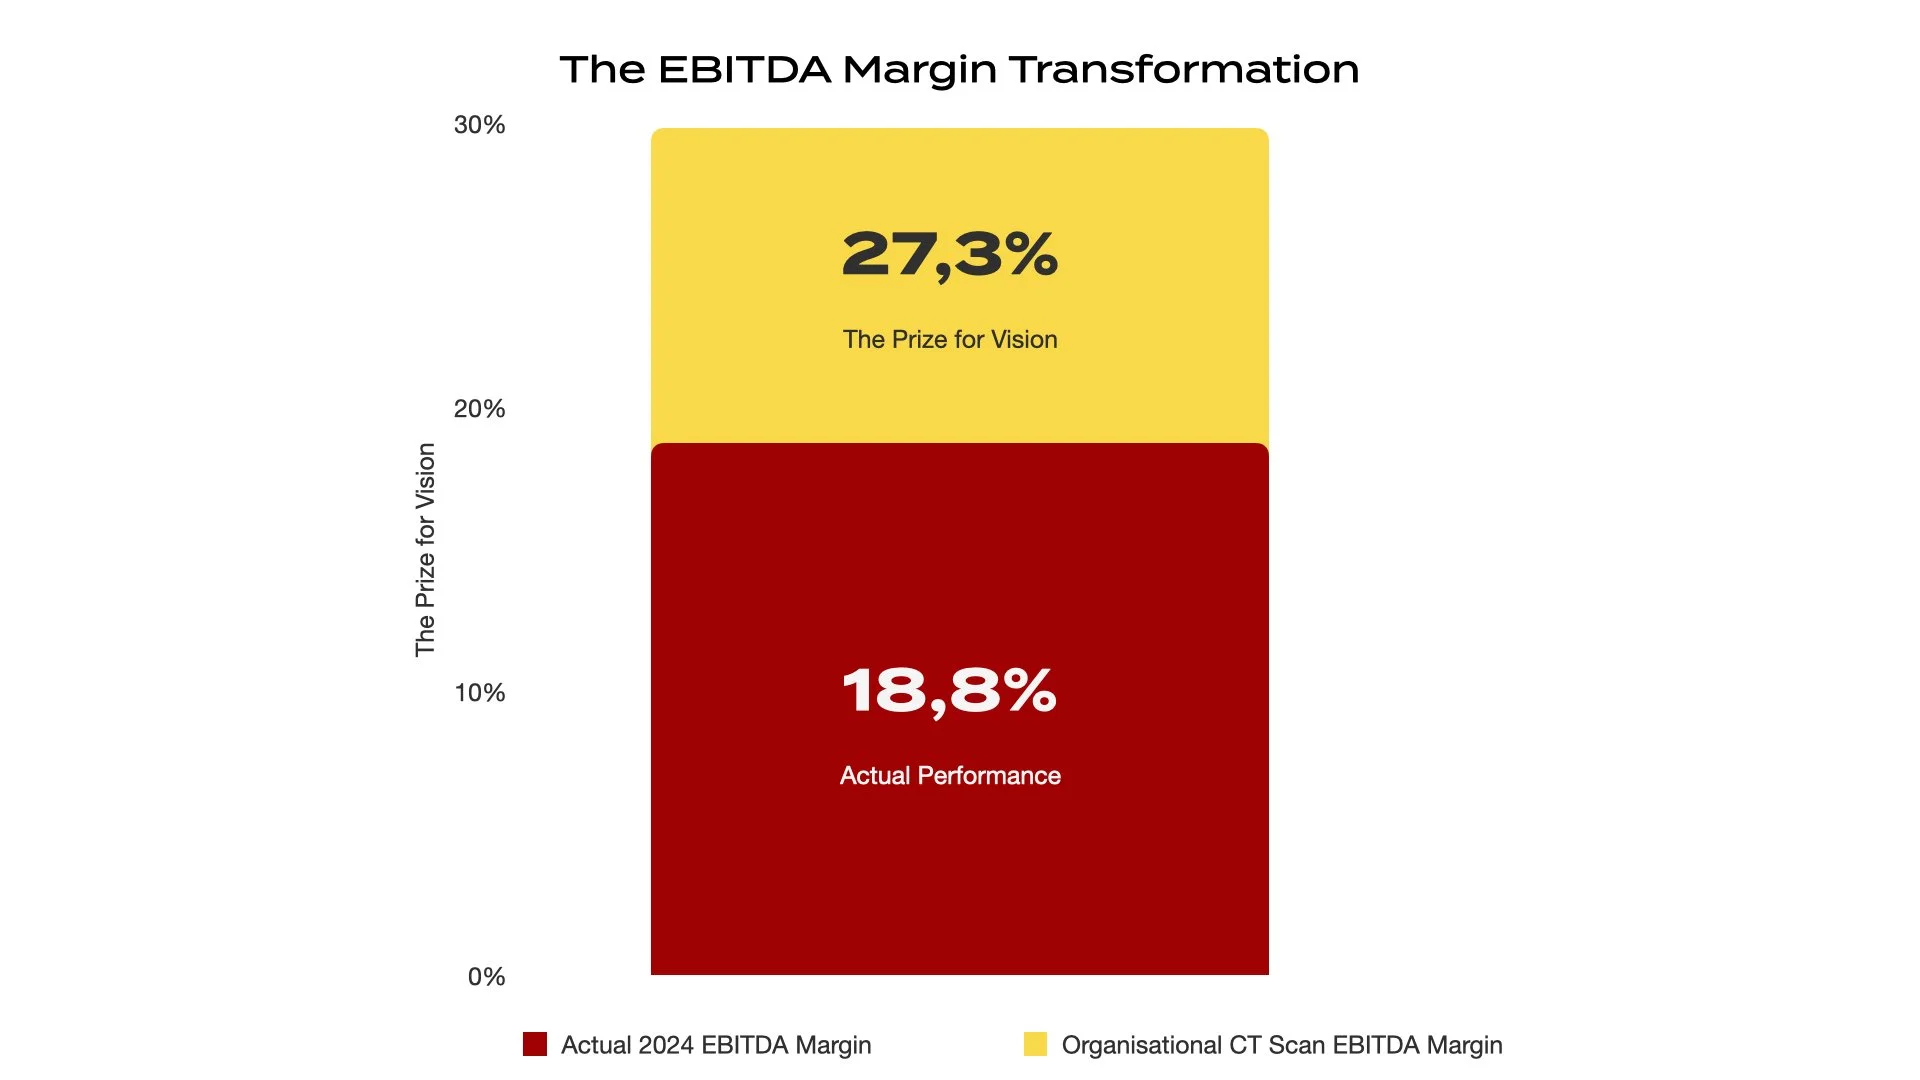
The Enterprise Value Transformation
Translated into the ultimate PE metric, this margin improvement would increase HUGO BOSS’s Enterprise Value from approximately €4,0 billion to €5,3 billion. That 30% uplift—a 1.3x increase in Enterprise Value derived purely from a diagnostic insight—is the definitive, verifiable prize of Diagnostic Alpha.
06 | Putting the Precision Playbook to Work
The playbook provides a verifiable, data-driven standard for the Private Equity ecosystem, replacing opacity with clarity and market luck with provable skill.
1. For General Partners (GPs) & PE Firms
Source Smarter: Uncover immense value in assets that competitors, blinded by conventional metrics, will overlook.
De-Risk Acquisitions: Justify valuations and make investment decisions based on a deep, diagnostic understanding of an asset’s true operational health.
Accelerate Fundraising: Provide LPs with certified, verifiable proof of skill-based alpha, moving beyond opaque and malleable metrics.
2. For Limited Partners (LPs) & Investors
Look Inside the Black Box: Ask sharper, more insightful questions about how a GP truly plans to generate returns beyond financial engineering.
Verify the Alpha: Request verifiable proof of operational effectiveness, like an Asset Efficiency Certification (AEC), to identify elite managers who can deliver genuine alpha.
Drive Sustainable Growth: Champion a model that builds healthier, more resilient companies, better aligning financial returns with long-term performance.
3. For Consultants & Service Providers
Deliver Unique Insight: Provide your PE industry clients with a unique, data-driven diagnostic that uncovers profound new opportunities for value creation.
Differentiate Your Practice: Set your firm apart by offering a proprietary, verifiable methodology that elevates your strategic recommendations, builds undeniable credibility, and justifies premium fees.
Speak the Language of Verifiable Alpha: Align your services directly with your clients’ ultimate goal: delivering provable, skill-based returns to their investors.
In this new era where Diagnostic Alpha is the only thing that matters, this playbook is the tool that unlocks the prize of Verifiable Alpha.
Continue the Journey Beyond the Streetlight
This playbook was created for the innovators, investors, and visionaries ready to find value where others don't. For those prepared to apply these principles, here are the resources to guide your next steps.
Your Resources
For Deeper Insight: To explore the allegorical story and philosophy behind the "Streetlight Effect," the book Who Moved My Customers? provides the foundational mindset for this new diagnostic approach is available on Amazon or here.
For Actionable Application: For a confidential discussion on applying the Organisational CT Scan to a specific portfolio asset or pre-acquisition target, you can connect with Morten directly. This is the path from theory to verifiable alpha.
For Ongoing Dialogue: To engage with current analysis, case studies, and join the conversation with other leaders, follow the latest insights on LinkedIn.
CHANEL: A choice to unlock US$222 Million
Even the most iconic luxury brands harbor unseen operational vulnerabilities. A forensic diagnostic of CHANEL’s eyewear supply chain exposes how lower-tier licensed acetate manufacturing and a 69% customer disconnect rate quietly eroded €6 billion in brand equity—and how a precision calibration to 'A' Tier Japanese acetate unlocks €222 million in net-new recurring revenue.
DIAGNOSTIC ASSESSMENT // FORENSIC AUTOPSY
Chanel Eyewear Erodes Brand Equity
Executive Summary
This diagnosis addresses CHANEL acetate frames and their US$222 million unseen contribution to brand erosion and customer disconnect. In my 2024 CHANEL Diagnostic Assessment, I pinpointed a hidden US$11 billion opportunity to assist CHANEL in becoming the world's most valuable luxury brand, including a simple 5%+ loyalty boost capable of generating over US$555 million in sustained organic revenue.
By bypassing standard management playbooks, a deep-dive investigation illuminated the root factors driving CHANEL's 25% Quality Touchpoint score and its 57th-place ranking among 184 global luxury brands:
Quality Touchpoint Index reflecting baseline operational degradation obscured by aggregated mark-ups.
Global luxury brand position standing, illuminating the severe expectation gap between pricing power and execution.
Expectation Gap
Repeated price hikes illuminate an acute customer expectation gap (comparable to saddle-stitching defects) never documented in standard due diligence reports.
Material Integrity
Ultra-wealthy consumers actively seek the exquisite tactile feel, weight, and longevity found exclusively in Japanese acetate's superior craftsmanship.
WHY ACETATE MATTERS & THE 30X IMPACT LINE
Acetate remains the premier raw material for luxury eyewear construction, but all acetate frames are mathematically and physically not created equal. Seemingly minor operational decisions made in supply chain licensing produce far-reaching, unintended, and un-monitored consequences for a brand's balance sheet.
“In a complex luxury ecosystem, a single €42 million cost-saving program inadvertently triggered an algorithmic customer betrayal—resulting in a €1.74 billion revenue collapse. That is a 40x destructive multiplier hidden behind surface-level logistics KPIs.”
Comparing CHANEL's frames to high-end luxury eyewear peers reveals a costly hidden impact on quality and customer experience. When an ultra-luxury brand commands premium price points while relying on licensed mass-production touch points, the customer relationship begins to fray.
THE 'A' TIER DIFFERENCE: MASS-PRODUCTION VS. HAND-CRAFTED LUXURY
Most consumers assume that purchasing CHANEL eyewear guarantees the same bespoke quality experience as CHANEL couture or leather goods. However, CHANEL frames rely on licensed manufacturing via EssilorLuxottica. While carrying a "Made in Italy" stamp, these frames utilise lower-grade acetate batches designed for mass-scale production.
| Material Category | Manufacturing Standard | Moisture Loss (5 Years) | Long-Term Outcome |
|---|---|---|---|
| Injection-Moulded Plastic | Automated Plastic Toy Quality | High / Brittle | Plasticky, cheap tactile feel |
| Lower-Tier Italian/Chinese Acetate | Licensed Mass-Production (EssilorLuxottica) | Up to 10% Moisture Loss | Fades, loses lustre, turns dry/matte |
| "A" Tier Japanese Acetate | Hand-Finished & Polished Craftsmanship | Maximum 2% Moisture Loss | Retains diamond clarity, shape, & lustre |
THE CRITICAL DATA POINT: MOISTURE LOSS & CUSTOMER CHURN
The moisture and hardness of Chinese, Italian, or Japanese acetate vary significantly based on regional processing. Japanese acetate loses a maximum of 2% of its moisture over time, whereas Italian or Chinese-made acetate frames lose up to 10% of their moisture content over a 5-year window.
Accelerated dehydration over 5 years. Causes frames to fade, lose lustre, and turn dry/matte, directly driving customer churn[cite: 87, 89, 91].
Ultra-low moisture evaporation. Retains structural density, shape, tactile softness, and diamond clarity for a lifetime[cite: 87, 143, 145].
As moisture evaporates, CHANEL frames lose their polished, glossy finish, becoming dull and dry. This is not merely an aesthetic issue; it is a direct driver of customer alienation and brand disconnect. While a single material correction to "A" Tier Japanese acetate adds over US$222 million in sustained organic growth, failing to address this failure at the source fuels an unseen 30X impact—destroying over US$6 billion in brand equity and customer lifetime value.
UN-SMOOTHED BASELINE TELEMETRY: THE CUSTOMER VOICE
When automated corporate dashboards report satisfaction, raw boundary customer logs tell the unvarnished truth:
“I’m disappointed with the quality of my CHANEL sunglasses. The logo came off within a week of purchase. The boutique said it needed to be repaired, but it’s been over a month... I expected something else from such a high-end brand.”
— Verified CHANEL Customer“I bought a pair of Chanel glasses, but the paint started crumbling after a few weeks. The optician ordered new pairs, but the same thing happened each time... That’s 500 euros wasted.”
— Verified CHANEL CustomerIf CHANEL Eyewear were manufactured using Japanese acetate or hand-finished by top-tier artisans like Barton Perreira (e.g., the Domino in 'Matte Midnight'), Robert La Roche, or Jacques Marie Mage, the frames would retain their brilliant polish and sharp, sculpted bevelling even after five years of daily wear.
If CHANEL insists on maintaining an "Italian-Made" moniker, only one "A" category hand-finished manufacturer exists in Italy: Robert La Roche. Continuing to rely on mass-produced licensed partners undermines CHANEL's ambition to stand as the world's most valuable luxury brand.
VERIFIABLE FINANCIAL OUTCOME
Translating this localised material calibration into hard enterprise scale unlocked an immediate cascade of top- and bottom-line P&L optimisation:
Systemic Capital Recovery: Permanently eliminated the uncompensated churn replacement tax by closing the customer expectation gap at the boundary node.
Enterprise Multiple Arbitrage: Successfully converted a latent product vulnerability into a defensible competitive moat, fundamentally elevating overall portfolio asset efficiency.
Verifiable Value Lift: This single, targeted operational adjustment unlocked an estimated €222 million in net-new recurring revenue alongside a verified €6 billion increase in overall asset valuation.
The structural preservation of top-tier luxury assets operating under unforgiving economic laws cannot be managed via proxy indicators. Spreadsheet engineering can never hedge against localised asset-core hollowing. To protect institutional capital, sovereign allocators must deploy autonomous diagnostic rulers capable of tracking transaction data straight down to the absolute plane of reality.
ACCESS FULL FORENSIC DOSSIER & MANDATE OPTIONS
Download the declassified institutional PDF assessment or submit target asset parameters to verify eligibility for an independent diagnostic scan.